The Power of Memes in Persuasion and Public Relations

The Power of Memes in Persuasion and Public Relations

I was recently gifted a signed first edition of Kermit Roosevelt’s book “Countercoup: The Struggle for the Control of Iran”.  It is a first-hand account of the CIA’s involvement in the coup in Iran.   

I have been thinking about the power of memes and their appeal while reading the book. 

On page 188, Kermit writes:

“I also ordered the CIA artists to get to work on artwork that could be used to support the coup plan. I wanted posters, leaflets, and other materials that would appeal to the Iranian people and encourage them to support the new government. I also wanted to have some propaganda materials that could be used to discredit the Mossadegh government and make it look like they were working against the interests of the Iranian people.”

To put this into context, he asked for artwork before he received approval for the plan to foment a coup in Iran.

Said a different way, the very first thing done to foment a coup, was to have the CIA create memes.  Why?

“Persuasion runs through the peripheral route.”

Humans have amazing brains that excel at keeping us (for the most part) alive. Because we are so efficient at this, our brains are often processing information much quicker than we can keep up.

The Limbic System

The brain can be split into two intertwined systems.

System 1 is quick (lighting quick) and operates at a subconscious level. It is automatic and we are almost powerless to stop it. It is a massive undertaking of processing stimuli including emotions to quickly assess a friend or foe. System 1 is often called the peripheral route.

System 2 is slower and operates when we DECIDE to use it. It is where we attempt to do our rational thinking. It requires great effort and is taxing. As a rule, we don’t spend much time here. System 2 is often called the deliberate route.

It is estimated that 5% of our thinking time may be spent in System 2.

Most of the time, especially in politics, and for those that aren’t that into politics, we spend a vast majority of time in system 1. Even those that have a well-thought-out political ideology and framework, set it and forget it.

It is the two-system brain that makes memes so persuasive.

The peripheral route of persuasion involves the recipient of the message focusing on peripheral cues, such as the attractiveness of the source, the credibility of the message, or the emotional appeal of the message, rather than on the content of the message itself.

Memes are little nuggets that operate in system 1. Often they confirm our biases, but they also are entertaining. Memes can be used to appeal to people’s emotions, values, and identities. All System 1 thinking.

On top of that, memes are easily shareable garnering discussion among peer groups and creating a shared understanding.

The quote “persuasion runs through the peripheral route” is a reminder that we should be critical of the messages we receive, especially when the messages are trying to persuade us to do something. We should not simply accept a message at face value, but should instead try to evaluate the arguments presented and consider the peripheral cues that are being used to influence us.

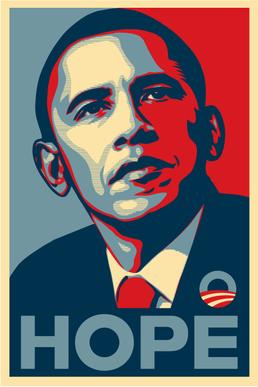
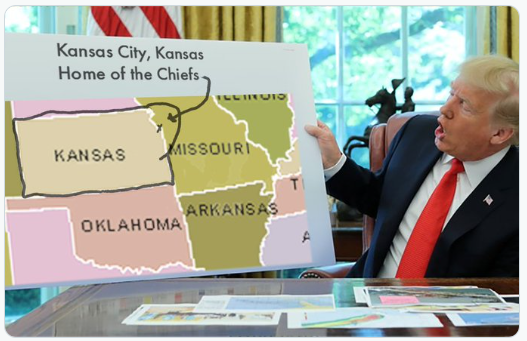
If we don’t, we may have grumpy cat to blame for our next revolution.

Announcing The ‘@’ Award: Twitter Power Users of the Florida Legislature

Announcing The ‘@’ Award: Twitter Power Users of the Florida Legislature

The ‘@’ Award & Twitter Power Users Ranking of Florida’s Elected Officials

Today Ozean announces 1) the 2023 Twitter Power Users of Florida’s Elected Officials Ranking and 2)The ‘@’ Award.

“It is no secret that significant political communication is happening on Twitter, and Ozean Media is studying the various ways Legislators use or don’t use Twitter to communicate. During this process, we have developed a method to quantify and acknowledge the power-users of Twitter of Florida’ elected officials,” said Alex Patton of Ozean Media.

Twitter Power Rankings

2023 Twitter Power Users of Florida’s Elected Officials Ranking acknowledges the top 10 power users of Twitter for the Florida House, Senate, executive branch, and federal branch.

The ‘@’ Award will be presented to the top power user of Twitter as measured for the time period of Florida’s regularly scheduled session.  After session concludes, The ‘@’ Award will be presented to the top-ranked state Representative and Senator.

“We understand there is a risk in studying Twitter with the current environment and changes with the platform, but we want to attempt to better understand how elected officials are using Twitter. We hope the Power Ranking is a first step,” concluded Ben Torpey of Ozean Media.

The initial rankings will be computed using the time-period of Feb 20, 2023 – March 3, 2023, and will be released Friday, March 3 at 3 pm.

The rankings for The ‘@’ Award will only cover the time-period of Florida’s regular session (March 5 – May 7 or Florida Session’s sine die whichever is later).
New rankings are computed and published every Friday during the special session at 3pm.

Leaderboards for Florida’s executive branch and federal branch are also compiled and ranked but are not eligible for The ‘@’ Award in 2023.

Leaderboards are published at: https://ozeanmedia.com/twitter-leaderboard

Any corrections or additions, please tweet @OzeanMedia or DM @OzeanMedia

More on the Ranking Algorithm

Given a specified time interval and a list of Twitter handles, the algorithm assigns a tailored weighting to variables including tweets, retweets, replies, follower count, following count, and effective reach.

The leaderboard is updated weekly and then displayed as an ascending order ranking.  Only the top 10 are released.  

The Twitter Lists

Any corrections or additions, please tweet @OzeanMedia or DM @OzeanMedia

How digital media boosts and lifts direct mail

How digital media boosts and lifts direct mail

Last year our firm was fortunate enough to have a client that liked and encouraged our desire to experiment and test.

Situation

We were attempting to test the validity and cost effectiveness of obtaining petitions via direct mail.  To do so, we created a self contained mail piece with perforated petitions.  To further reduce friction, we paid for return postage and used variable printing to pre-fill the petitions with all needed information.  Literally “all” the voter needed to do was sign, date, tear off, and drop in the mail.

Our test universe were households with voters with a history of voting in primaries. It was a large enough test universe to allow for testing multiple conditions.

We were brainstorming different creative elements (social proof, colors, calls to action) and then Ben asked “Why are we limiting ourselves to only direct mail?”

A great question.   We approached the client and said since we are testing direct mail, let’s see if we can push it.   The client agreed with the push and added some additional funds to the project.

We separated three test groups.

  • Group 1 – Control – received direct mail only.
  • Group 2 – Direct mail with a layered a digital campaign over the top.
  • Group 3 – Direct mail, layered digital campaign, and received a personalized text message.

Most direct mail response rates are 1-2%.  We hypothesized that the control group’s response rate would be 1% and Group 2 & Group 3 would be lifted to 2.5%.

Once again, we were dead wrong.

We had a mail date of mid-month.

Digital Media

10 days before the mail went out, groups 2 & 3 began seeing a targeted digital campaign. The creative essentially said “Look for your petition in the mail” and it clicked through to a landing page specifically about the petition.

Both display and facebook were used. The digital audience mirrored the mail groups exactly using proprietary methods.

The digital campaign continued until 10 days after the mail drop. 20 days in total.

Text campaign

The day of the mail drop, Group 3 began to receive personalized text messages:

{first_name}, this is Al from the xx campaign.In the coming days,you will receive a petition in the mail.Please read,sign & return.”

The text was repeated 2 days later, minus the opt outs of course.

Waiting

And then we waited. 1 day…2 days….7 days….nothing.

The panic began to set in. Did we just waste a a ton of money?

No, we did not.

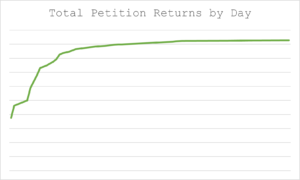
Then came the glorious day of first returns. The PO Box was stuffed AND it contained a note from the post master “please see us at the counter.” At that time, we were handed a basket of returns. We were excited, and couldn’t wait to run the stats. But how long could we wait for returns before computing the stats? Within 10 business days of returns beginning, we received 78% of what were in the end going to receive. However, we received returns for 45 days. Yes, they slowed to a trickle, but I know from the date of signature, the petitions were being signed up to 40 days after the mail drop. Total Returns We were extremely pleased with the returns, but couldn’t wait to explore the data to explore was there a real difference between the groups? When we finally went two consecutive business days, we allowed ourselves permission to compute the “final” stats:

%

Group 1 Response Rates

%

Group 2 Response Rates

%

Group 3 Response Rates

Cost Effectiveness

Yes, we did spend more on Groups 2 & 3. So was the increased response rates more cost effective? Yes! Group 2 (digital media only), even with an increase in spending was a 1% reduction in cost per returned petition when compared to the control group. Group 3 (digital media and texting), Even with an increase in spend, it was a 3.6% reduction in cost per returned petition when compared to the control group.

Conclusion

The secret sauce of this entire experiment was limiting the waste and precisely targeting the digital. As we briefly mentioned, it was limiting the digital audiences to as close of an exact overlay as possible. We were targeting super-voters in a specific geographical area (not everyone with an interest in politics). It was this precision that drove response rates AND made it cost effective. How did we do that exactly? Call us about your next project……

Keys to Success in the Age of Non-stop Campaigning: Digital, Data, and List Building

We are in the age of non-stop campaigning. It goes without saying that the campaign for 2022 began the morning after the November 3rd election. The key to victory? Building a data-driven, digital-first strategy to build your email list.

Emails are the golden key to successful campaigns. Emails are a direct way to identify and contact your supporters for fundraising, campaign updates, and calls to action. Most importantly, building your own list gives your campaign or organization independence – no social media bureaucrat can magically take away your ability to communicate with your audience.


Data-driven, digital-first strategies have transformed list building. Long gone are the days of waiting for supporters to put their name on a physical sign-in sheet at a campaign event. Rather, it is now possible to identify, target, and recruit the most likely candidates to build your list.


Correctly building and maintaining your database is critical for success. Often, the low-hanging fruit is individuals who have a history of donating to similar causes or candidates. Once the initial database is built-out, you have a list of interested individuals to target digitally with the goal of collecting their email addresses. 


Using precise, IP-targeted software, you can consistently stay in front of your target audience with highly targeted digital ads. When the ad is clicked, your target will be asked to submit their email. 


Our clients have had great success building their list in the months and even years leading up to an election. Beginning this process well in advance allows you to amass a list of supporters ready to activate as the election draws near.

Amelia’s Review of 2020: Political Research, Data, and Digital Media

This year, Ozean’s top staff will be presenting their own “Year in Review of 2020” comprised of their top takes in three areas: Digital Media, Political Research, and Political Data.

This is Amelia’s review of 2020 in political research, data, and digital media. A persepctive from a first time voter in the most polarizing election yet. 

Digital Media

 It’s been a very long year. We have been working through a global pandemic and have faced one of the most challenging election cycles in our nation’s history. This election cycle was my first time qualifying to vote in a Presidential race and I couldn’t have imagined a more exciting one even if I tried. With Americans living on their technology to work remotely and lockdowns limiting other activities, digital marketing pushes in campaigns became more crucial than ever. What came out of this big digital push were some very memorable campaign ads such as the one from Maryland’s congressional candidate Kimberly Klasick that went viral and brought in millions in fundraising dollars. It was a savvy digital ad that made the candidate look and feel relatable to voters from her district and demonstrated the hypocrisy of the democratic incumbent.  


Political Research

 Although this election was polarizing and maddening, it did give us many interesting voter statistics to look into. One of the most interesting findings was how the Latino communities in Texas have swung greatly over to the Republicans. From Brownsville to El Paso, Trump picked up a lot of support from Mexican voters unlike ever before. In 2016, Trump lost all 18 Texas counties where Latinos make up at least 80% of the population. This time he won five of them and closed the gap considerably in the rest. What was possibly the cause of his unlikely success in these areas was his strong support for law enforcement and his defending of the oil industry. These two fields are how many support their families in these areas of Texas. 

Political Data 

This year’s senate race between Tommy Tuberville and Doug Jones was a big one to say the least. Jones outspent Tuberville by a long shot and broke an Alabama record for campaign spending. A lot was riding on this seat for the Democrats but Republicans knew how crucial it was to flip the seat back red. Most polling done throughout this campaign always showed Tuberville up by a considerably large margin, but then an internal poll came out from FM3 Research that had Jones up by 1 point. As someone who interned and worked on the campaign, this came as a big surprise and we knew immediately it was a faulty poll. This polling was wildy innacurate considering the outcome of the election giving Tuberville a 20% win. This goes to show that the side that pumps the most money into an election does not always come out on top! 

Ben’s Review of 2020: Political Digital Media, Research, and Data

This year, Ozean’s top staff will be presenting their own “Year in Review of 2020” comprised of their top takes in three areas: Digital MediaPolitical Research, and Political Data.

This is Ben’s review of 2020 in political digital media, research, and data.

Political Digital Media

It is no surprise that digital advertising is becoming increasingly important to political campaigns. In 2020, amid COVID-19, lockdowns, protests, and – finally – the most divisive presidential election in modern politics… digital media became NECESSARY for political campaigns.

Instead of knocking on doors, campaigns shifted to virtual canvassing. Rather than recruiting volunteers to phone bank from a central location, campaigns utilized decentralized phone systems or P2P texting applications. Boots on the ground campaigning at every level turned into virtual campaigning.

THE BIG SURPRISE: Despite the importance of digital media, social media platforms – such as Facebook – placed stringent restrictions on political digital ads in the final week of the 2020 November election. Almost two months later, now in late December, Google and Facebook are STILL banning political ads, except for ads focusing on the Georgia Special Senate Election. This ban has restricted the ability of political organizations across the U.S. to get their message out.

Political Research

The Pollster Comeback

In 2016, political polling took a shot to the ribs. In 2020, many of the same folks in the media are saying that political polling failed us yet again because pollsters underestimated how well Donald Trump would perform, despite his loss. Looking back at the 2020 election polling…  these folks are, for the most part, wrong.

At the state level, although some polls underestimated Trump’s performance, they were pretty damn accurate – often falling within a 4-point margin of error. Using Real Clear Politics polling averages as a barometer, Trump overperformed outside of the margin of error in a few states, such as Florida (+4.2), Texas (+4.5), Ohio (+7.2), and Wisconsin (+6). In other states, such as Arizona (+0.6), Pennsylvania (+0.0), North Carolina (+1.2), Michigan (+1.4), and Georgia (-1.3), polling predicted results to a tee.

Taken as an average, polling data correctly predicted the winner or fell within the margin of error in 49 of 50 states. The ONLY state that pollsters got wrong (and was outside the margin of error) was Florida.

Although some polls were particularly embarrassing to look at – like the mainstream polls that had Biden +10 to +15 in some battleground states – polling was rather accurate in predicting the 2020 results.

Find the Real Clear Politics results here.

Political Data

My biggest political data story of 2020 brings us down to my home state of Florida – Republicans in Florida have far outpaced Democrats in voter registration. I blogged about this trend in 2019, citing that if Republicans keep it up, Trump is in good shape to win Florida in 2020 and that Democrats have a shot if they push their registration lead to 500,000 (Obama-era levels).

In 2020, Republicans further closed the gap and are only behind Democrats by 116,950 registered voters. This is BIG DEAL for Florida Republicans and the Presidential election results reflect this with Trump winning the state by 2.3%… a blow-out by Florida’s standards. Not only did Florida vote for Trump yet again, but Republicans were also able to flip two Democratic Congressional seats in South Florida.

If this voter registration trend continues, the future is bright for Florida Republicans.