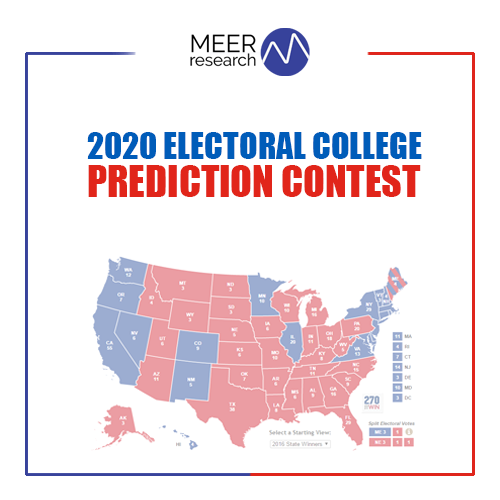
Ozean Media and Meer Research recently sponsored a contest asking people to predict the Electoral College outcome for 2020. We thought we would share the predictions and results with you.
Winner of Electoral College – Biden / Harris
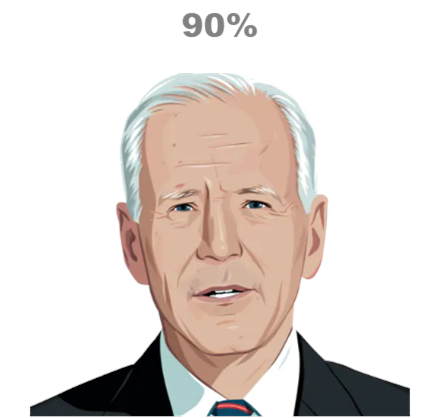
90% of the contestants picked the correct winner of the Electoral College to be President-elect Joe Biden.
Electoral College – Detail
On average, our contestants predicted 320 Electoral College votes for Joe Biden and 219 for Donald Trump. (totals do not equal 538 due to rounding).
Electoral College Prediction Accuracy
On average, contestants were more bullish on Joe Biden’s chances – predicting approximately 14 more Electoral College votes for Joe Biden than the actual results.
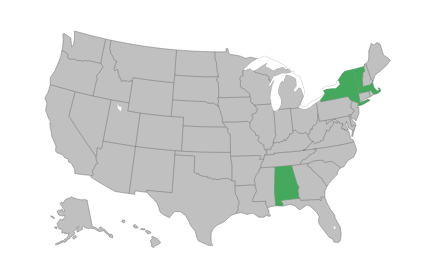
Electoral College – States Detail
On average, 8 states / electoral college allocations were predicted incorrectly by contestants.
The most missed / incorrect calls: ME CD2 (79% incorrect), GA (76% incorrect), NC (72% incorrect), NE CD2 (62% incorrect), and Florida (55% incorrect).
The perfect calls: 100% of contestants picked correctly: AL, MA, NY, and VT.
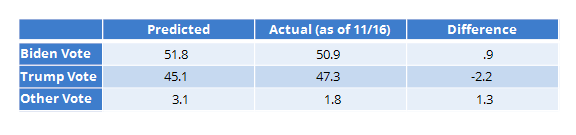
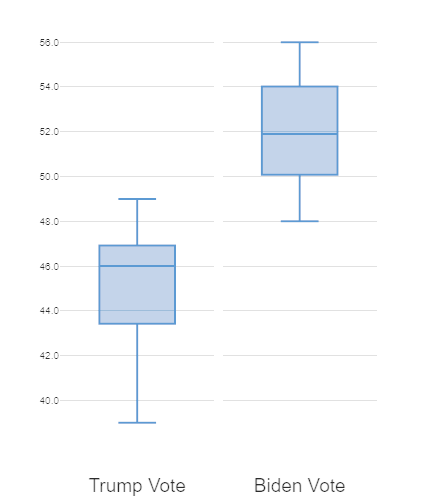
Popular Vote Prediction Accuracy
On average, contestants predicted the popular vote share as: 51.8% for Joe Biden, 45.1% for Donald Trump, and 3.1% for Other.
As of the writing of this, the Cook Political Report shows a popular vote share of 50.9% for Joe Biden, 47.3% for Donald Trump, and 1.8% for Other.
Conclusion
We enjoyed hosting the contest, and found the results to be interesting.
We are awaiting permission from the winner to publicly release his name, and if granted we will do so.
The most interesting thing to me was the fact that someone could in theory mis-call a significant number of states and yet still arrive at the “correct” electoral votes. Something to think about when writing contest rules.
Interesting test this week with Meer Research in regard’s to the impeachment of President Donald Trump. This is a cross-post from Meer Research.
We had an internal debate on the potential wording of the question. Instead of guessing, we set out to do a quick simple test – exploring a small variation in a question.
Donald Trump has not done anything wrong and doesn’t deserve impeachment or removal from office.
Donald Trump has done nothing wrong and doesn’t deserve impeachment of removal from office.
Donald Trump has done something wrong, deserves a reprimand but not impeachment or removal from office.
Donald Trump has done something wrong, deserves impeachment, but not removal from office.
Donald Trump has done something wrong, deserves impeachment and removal from office
That was the test – the first question.
Again, quick test. Put it on Facebook and another request on reddit. Survey started 1/30/2020 and ended 2/1/2020. (In the end, there was no difference between the question versions.)
However, an observation indicates additional research is likely needed on the impeachment question.
Let me add some MAJOR caveats here: This is by no means a proper sample. When compared to registered voters, respondents skew whiter (much), skew older, and likely skew towards higher levels of education. Interestingly, the distribution among ideology is almost a perfect bell curve -ranging from very conservative to very liberal.
Ambivalence
Often impeachment is offered as a binary choice – Yes / No, and often this is a decent indicator in today’s political environment. But there is significant research that indicates the public has a much more nuanced approach to issues. For example, abortion. Abortion is pretty black and white and often presented in a binary choice – pro-life vs pro-choice. But there is a significant body of research showing Americans often have a more nuanced approach to the abortion issue. (Shout out to Dr. Craig and Dr. Martinez at University of Florida – Sometimes You Feel Like a Nut, Sometimes You Don’t: Citizens’ Ambivalence About Abortion)
What we observe with this small, flawed survey is that early, exploratory indications are there may be some nuance towards impeachment even in this hyper polarized environment.
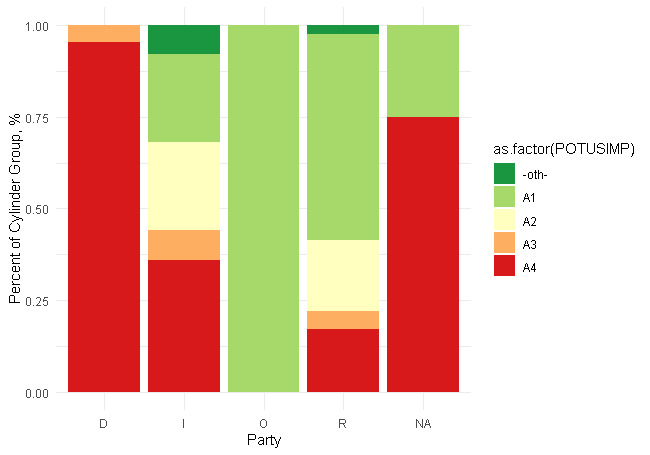
Impeachment by Party
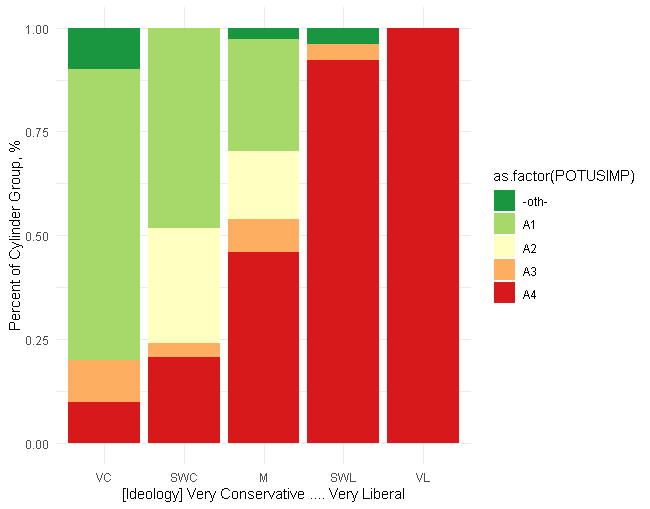
Impeachment by Ideology
(I apologize for not making the graphs prettier but there is only so much a person can do while waiting on his daughter to finish dance class) But they are color coded from green (President Trump did nothing wrong, should not be impeached, should not be removed from office) to red (President Trump did something wrong and should be impeached and removed from office)
I took a peek at impeachment across party identification and ideology (5 point scale).
I repeat: this is NOT a scientific survey – BUT this shows me impeachment deserves a deeper look than the binary choice offered by the process.
Well not among my liberal and Democrat friends – you guys are pretty much in lock step with “throw the President out.”
But my conservative friends, moderate friends, and Independents – all are blinking “nuance”.
Conclusion on Impeachment Indicators
I want to be be very clear: I wouldn’t draw anything from this other than more research is needed on the topic, but……. if I am a Republican operative, I would do the research quickly.
PS. A respondent offered their own choice: “Donald Trump has done something wrong but doesn’t deserve impeachment or removal.” (dropping the reprimand) I do think that is a valid point and even more nuance.
Some weekend projects start with a simple question, this past weekend was no different.
“How much churn is there in Florida’s voter file?”
We wanted to get a sense of how much churn was in the voter file leading up to the 2020 election. We took the voterfile from Jan 2019 and compared it to the voterfile in December of 2019. (We went county by county using the R library CRAN compareDF) For the period of 2019, we wanted to explore how many records changed, how many were added, and how many were removed.
In the aggregate, it would appear there isn’t much churn or turnover in the voterfile. The number of registered voters grew about 2% for the year. However, that masks the story.
On average, 7% of the voters had changes in their data (this can be anything from switching parties, address changes, having the precinct number change, etc), 7% were additions, and 5% were removed during that time.
In 2020, Florida added 979,146 voters and removed 741,312 voters.
But my take away is this – remember there are differences in macro- behavior and micro-behavior – and macro level changes maybe masking much larger micro-shifts.
Below are the county breakdowns, some of the counties that exhibit high percentages of change were shifting / changing precinct numbers.
Statewide elections in Florida are among the most competitive and hotly contested elections in the United States. Since 2012, six statewide elections have been decided by less than 1.2% while three have been won by fewer than 35,000 votes. Once you realize there are 13 million registered voters in Florida, these results are jarring.
Florida Democrats are Losing the Registration Game
Since 2012, only one Democrat (Nikki Fried) has won a statewide election in Florida – a result decided by just 6,500 votes. Clearly, Florida Democrats have a ‘winning’ problem.
In the age of Trump, politicos anticipated a better performance by Florida Democrats in 2016 and then again in 2018 amid the supposed “blue wave.” Rather than riding the blue wave, Florida voters fought the current and elected a Trump-endorsed Republican governor and fired an 18-year incumbent Democratic Senator. Why? How?
Florida GOP is Closing the Registration Gap
Many reasons could explain the poor performance by Florida Democrats but one major data point stands out – voter registration. As of late, Republicans have been beating Democrats at their own game. Plain and simple.
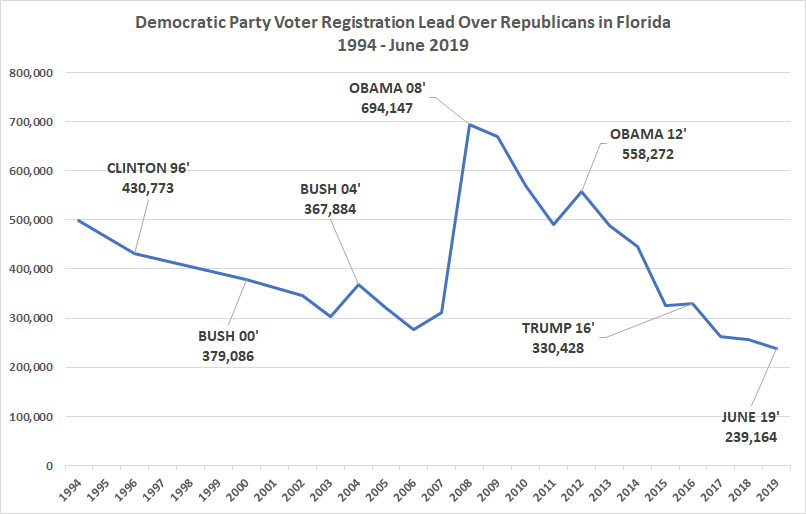
Although the Republican Party is currently home to one of the most unfavorable presidents in American history, Florida Democrats hold the smallest lead over Republicans in voter party registration since Florida began recording the statistic in 1972.
Compare that to just ten years ago when Florida Democrats had a 700,000 registration lead over Republicans, setting the stage for Obama’s sweeping victory in 2008. Since then, Republicans shaved the Democratic lead down to just 250,000 – a reduction of roughly 450,000 registered voters.
Florida Department of State Division of Elections, “Voter Registration – By Party Affiliation Archive,” August 4, 2019
Can Florida Turn Blue in 2020?
Anything is possible. But fifteen months from election day, Republican registration is on track for a Trump victory in Florida. Bar a Trump campaign catastrophe, an economic collapse, or Joe Biden forgetting that he is running for president – again, anything is possible – historical election data reveals that Democrats need a 500,000 lead in voter registration for a solid chance at winning Florida in 2020.
Unfortunately for Republicans, it is not unprecedented for Democrats to grow their registration lead in the year leading up to a presidential election (see graph from 2007-2008). On top of that, Democrats identified the need to register Florida voters as evidenced by Andrew Gillum’s plan to register 1 million voters before the 2020 election. All Gillum has to do is follow through and turn down Hamilton tickets.
Only time will tell if Florida Democrats rise to the occasion.
I will check in with updates as we countdown to election day 2020.
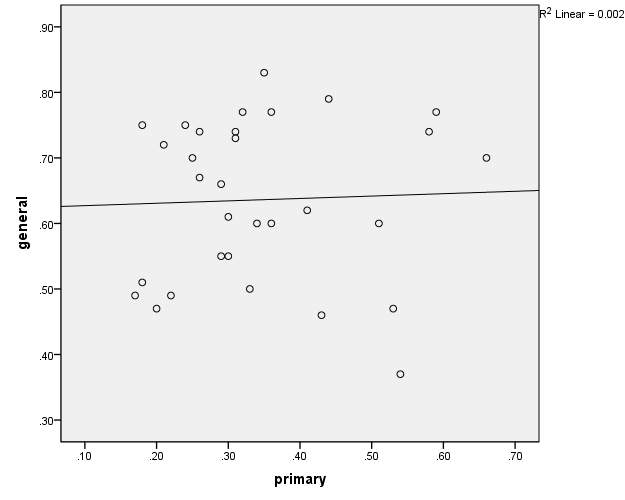
The relationship between primary turnout and general election turnout in Florida Elections (1954-2016)
Correlations
primary
general
primary
Pearson Correlation
1
.039
Sig. (2-tailed)
.834
N
31
31
general
Pearson Correlation
.039
1
Sig. (2-tailed)
.834
N
31
32
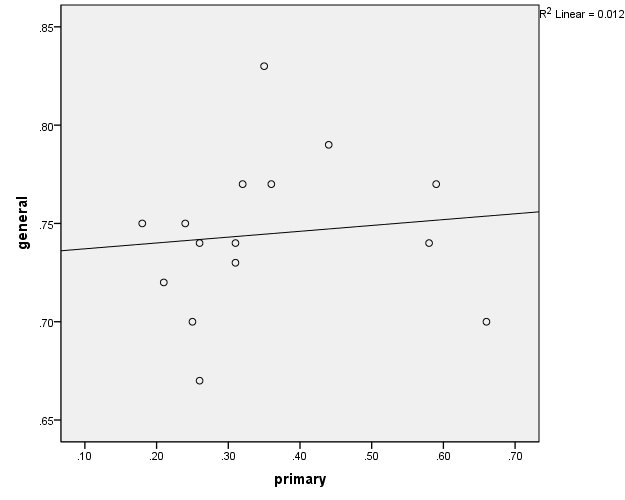
POTUS ONLY YEARS
Correlations
primary
general
primary
Pearson Correlation
1
.111
Sig. (2-tailed)
.693
N
15
15
general
Pearson Correlation
.111
1
Sig. (2-tailed)
.693
N
15
16
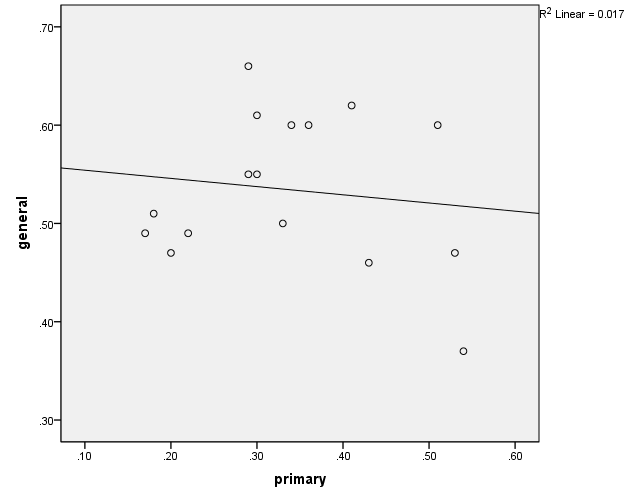
MIDTERMS ONLY YEARS
Correlations
primary
general
primary
Pearson Correlation
1
-.130
Sig. (2-tailed)
.632
N
16
16
general
Pearson Correlation
-.130
1
Sig. (2-tailed)
.632
N
16
16
Conclusion
There is no measurable relationship between the two variables; need to explore other potential variables that may predict general election turnout better – such as the number of competitive races.
Thinking about 2018 with a potential matchup of Rick Scott v Senator Bill Nelson, I was messing around with scripts to combine data sets and came up with vote totals for the 2014 campaign for Florida Governor featuring Rick Scott v Charlie Crist by Florida DMA (Television Markets).
Here you go…..I may write later on what this possibly means for 2018, but for now, it is provided as is for your enjoyment.
We use cookies on our website to give you the most relevant experience by remembering your preferences and repeat visits. By clicking “Accept”, you consent to the use of ALL the cookies.
This website uses cookies to improve your experience while you navigate through the website. Out of these, the cookies that are categorized as necessary are stored on your browser as they are essential for the working of basic functionalities of the website. We also use third-party cookies that help us analyze and understand how you use this website. These cookies will be stored in your browser only with your consent. You also have the option to opt-out of these cookies. But opting out of some of these cookies may affect your browsing experience.
Necessary cookies are absolutely essential for the website to function properly. These cookies ensure basic functionalities and security features of the website, anonymously.
Cookie
Duration
Description
cookielawinfo-checkbox-analytics
11 months
This cookie is set by GDPR Cookie Consent plugin. The cookie is used to store the user consent for the cookies in the category "Analytics".
cookielawinfo-checkbox-functional
11 months
The cookie is set by GDPR cookie consent to record the user consent for the cookies in the category "Functional".
cookielawinfo-checkbox-necessary
11 months
This cookie is set by GDPR Cookie Consent plugin. The cookies is used to store the user consent for the cookies in the category "Necessary".
cookielawinfo-checkbox-others
11 months
This cookie is set by GDPR Cookie Consent plugin. The cookie is used to store the user consent for the cookies in the category "Other.
cookielawinfo-checkbox-performance
11 months
This cookie is set by GDPR Cookie Consent plugin. The cookie is used to store the user consent for the cookies in the category "Performance".
viewed_cookie_policy
11 months
The cookie is set by the GDPR Cookie Consent plugin and is used to store whether or not user has consented to the use of cookies. It does not store any personal data.
Functional cookies help to perform certain functionalities like sharing the content of the website on social media platforms, collect feedbacks, and other third-party features.
Performance cookies are used to understand and analyze the key performance indexes of the website which helps in delivering a better user experience for the visitors.
Analytical cookies are used to understand how visitors interact with the website. These cookies help provide information on metrics the number of visitors, bounce rate, traffic source, etc.
Advertisement cookies are used to provide visitors with relevant ads and marketing campaigns. These cookies track visitors across websites and collect information to provide customized ads.