This year, Ozean’s top staff will be presenting their own “Year in Review of 2020” comprised of their top takes in three areas: Digital Media, Political Research, and Political Data.
This is Amelia’s review of 2020 in political research, data, and digital media. A persepctive from a first time voter in the most polarizing election yet.
Digital Media
It’s been a very long year. We have been working through a global pandemic and have faced one of the most challenging election cycles in our nation’s history. This election cycle was my first time qualifying to vote in a Presidential race and I couldn’t have imagined a more exciting one even if I tried. With Americans living on their technology to work remotely and lockdowns limiting other activities, digital marketing pushes in campaigns became more crucial than ever. What came out of this big digital push were some very memorable campaign ads such as the one from Maryland’s congressional candidate Kimberly Klasick that went viral and brought in millions in fundraising dollars. It was a savvy digital ad that made the candidate look and feel relatable to voters from her district and demonstrated the hypocrisy of the democratic incumbent.
Political Research
Although this election was polarizing and maddening, it did give us many interesting voter statistics to look into. One of the most interesting findings was how the Latino communities in Texas have swung greatly over to the Republicans. From Brownsville to El Paso, Trump picked up a lot of support from Mexican voters unlike ever before. In 2016, Trump lost all 18 Texas counties where Latinos make up at least 80% of the population. This time he won five of them and closed the gap considerably in the rest. What was possibly the cause of his unlikely success in these areas was his strong support for law enforcement and his defending of the oil industry. These two fields are how many support their families in these areas of Texas.
Political Data
This year’s senate race between Tommy Tuberville and Doug Jones was a big one to say the least. Jones outspent Tuberville by a long shot and broke an Alabama record for campaign spending. A lot was riding on this seat for the Democrats but Republicans knew how crucial it was to flip the seat back red. Most polling done throughout this campaign always showed Tuberville up by a considerably large margin, but then an internal poll came out from FM3 Research that had Jones up by 1 point. As someone who interned and worked on the campaign, this came as a big surprise and we knew immediately it was a faulty poll. This polling was wildy innacurate considering the outcome of the election giving Tuberville a 20% win. This goes to show that the side that pumps the most money into an election does not always come out on top!
This year, Ozean’s top staff will be presenting their own “Year in Review of 2020” comprised of their top takes in three areas: Digital Media, Political Research, and Political Data.
This is Ben’s review of 2020 in political digital media, research, and data.
Political Digital Media
It is no surprise that digital advertising is becoming increasingly important to political campaigns. In 2020, amid COVID-19, lockdowns, protests, and – finally – the most divisive presidential election in modern politics… digital media became NECESSARY for political campaigns.
Instead of knocking on doors, campaigns shifted to virtual canvassing. Rather than recruiting volunteers to phone bank from a central location, campaigns utilized decentralized phone systems or P2P texting applications. Boots on the ground campaigning at every level turned into virtual campaigning.
THE BIG SURPRISE: Despite the importance of digital media, social media platforms – such as Facebook – placed stringent restrictions on political digital ads in the final week of the 2020 November election. Almost two months later, now in late December, Google and Facebook are STILL banning political ads, except for ads focusing on the Georgia Special Senate Election. This ban has restricted the ability of political organizations across the U.S. to get their message out.
Political Research
The Pollster Comeback
In 2016, political polling took a shot to the ribs. In 2020, many of the same folks in the media are saying that political polling failed us yet again because pollsters underestimated how well Donald Trump would perform, despite his loss. Looking back at the 2020 election polling… these folks are, for the most part, wrong.
At the state level, although some polls underestimated Trump’s performance, they were pretty damn accurate – often falling within a 4-point margin of error. Using Real Clear Politics polling averages as a barometer, Trump overperformed outside of the margin of error in a few states, such as Florida (+4.2), Texas (+4.5), Ohio (+7.2), and Wisconsin (+6). In other states, such as Arizona (+0.6), Pennsylvania (+0.0), North Carolina (+1.2), Michigan (+1.4), and Georgia (-1.3), polling predicted results to a tee.
Taken as an average, polling data correctly predicted the winner or fell within the margin of error in 49 of 50 states. The ONLY state that pollsters got wrong (and was outside the margin of error) was Florida.
Although some polls were particularly embarrassing to look at – like the mainstream polls that had Biden +10 to +15 in some battleground states – polling was rather accurate in predicting the 2020 results.
My biggest political data story of 2020 brings us down to my home state of Florida – Republicans in Florida have far outpaced Democrats in voter registration. I blogged about this trend in 2019, citing that if Republicans keep it up, Trump is in good shape to win Florida in 2020 and that Democrats have a shot if they push their registration lead to 500,000 (Obama-era levels).
In 2020, Republicans further closed the gap and are only behind Democrats by 116,950 registered voters. This is BIG DEAL for Florida Republicans and the Presidential election results reflect this with Trump winning the state by 2.3%… a blow-out by Florida’s standards. Not only did Florida vote for Trump yet again, but Republicans were also able to flip two Democratic Congressional seats in South Florida.
If this voter registration trend continues, the future is bright for Florida Republicans.
This year, Ozean’s top staff will be presenting their own “Year in Review of 2020” comprised of their top takes in three areas: Digital Media, Political Research, and Political Data.
This is Alex’s review of 2020 in political research, data, and digital media. Three topics that caught my attention during 2020 and none of them COVID related. Okay, some of them are COVID related.
Digital Media
The year of the virtual campaign. 2020 was…unique and forced change into how campaigns are run. It hastened the world of dispersed technologies for volunteers and staff (phone banks, text banks), temporarily changed response rates in polling, and hastened budget swings towards digital outreach.
I think we will look back at the 2020 campaign cycle as the cycle digital media came of age.
This year, digital media spends accounted for less than 75% of total political ad spend; however, digital media experienced explosive growth (most of it in smaller donor solicitations).
As digital marketers continue to experiment with using digital in persuasion messaging, we expect digital marketing budgets to continue to grow.
Political Research
In the journal of Political Psychology, an interesting experiment caught my eye this year.
The Influence of Identity Salience on Framing Effectiveness: An Experiment conduct by Emily P. Diamond of Duke University.
This was an interesting online experiment beginning the explore frame effects of messaging on highly polarized topics. In this case, the author explored framing effects of identities on climate change. Specifically, if a parental identity is primed before asking about climate change would it have an effect on political behaviors?
As the study concludes, “communicating messages when partisan identities are highly salient is likely to increase polarized responses, while communicating while nonpartisan identities are salient may be helpful in depolarizing responses.”
This gels with my belief that when an issue(s) is highly polarized, going directly at it in any partisan manner will likely get you nowhere – especially if you are attempting to persuade or change behaviors.
While, there is still much work to do this in this area such as researching how long these effects linger, if at all. I mean, as soon as a partisan identity takes over – you may be back to square one.
But for now, if you want to talk about highly partisan issues with an eye to persuade or change behaviors, you may need a trojan horse, ie or a different frame.
Political Data
Google announcing the phase out of third party cookies is my data story of the year, and it was announced at the beginning of 2020.
At the beginning of 2020, Google announced their timeline for phasing out third party cookies from Chrome.
Third party cookies are the little bits of data that companies put on your computer to “make ads more relevant” to the user….also known as “tracing them”. It is these little bits of data that allow digital agencies to target users on in individual manner.
While third party cookies have also been banned by Apple, Microsoft and Mozilla, Chrome is well over half the browser market, so this is a major change to the entire digital landscape.
The death of the cookie has been whispered about for years, and we all kinda knew it was going to happen….just not exactly when.
Now we know: Google says it is a phased approach not to take full effect until 2022.
What does this mean for digital advertising? It means first-party data is at a premium, and this move is likely to strengthen the hand of the “walled gardens” of ad tech – like….google, facebook, microsoft.
But for now, we continue to monitor the changes and watch closely how the advertising industry adjusts to a soon to be cookie free world.
Admittedly, I have been slacking in writing. This is due to workload and frankly falling off the writing wagon.
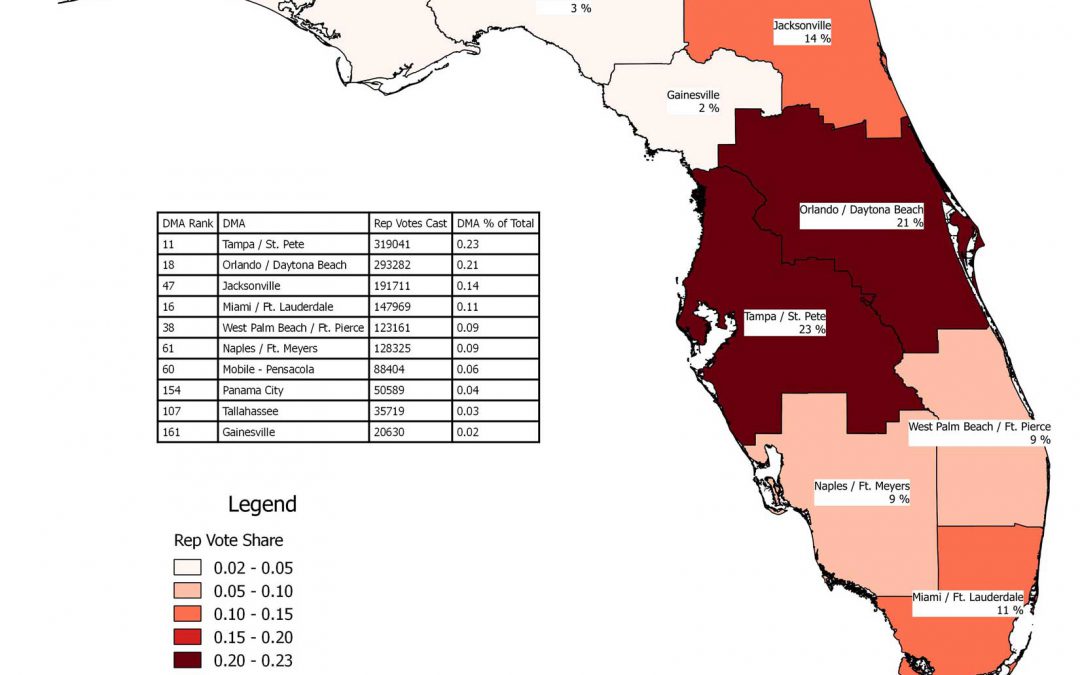
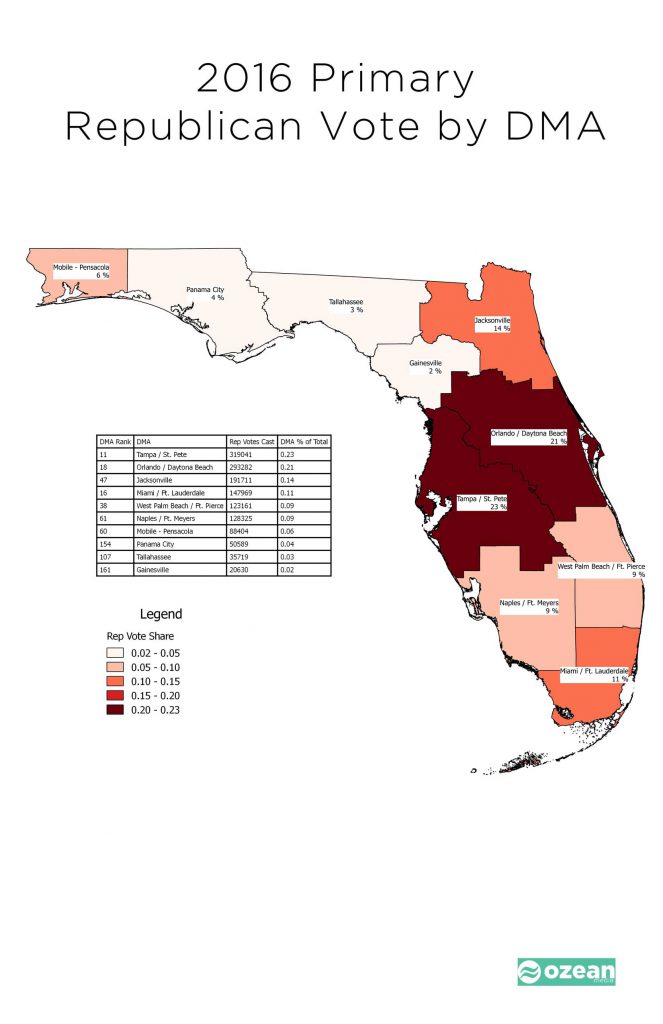
I will try and do better, but in the meantime, I was asked to look at Republican Turnout in Florida. I only explored those voters currently registered in Florida that voted in the 2016 primary.
I only explored those voters currently registered in Florida that voted in the 2016 primary.
I chose to look at the turnout by Florida DMA – and you see the critical nature of the heralded I-4 corridor. Nearly 1 out of every 2 Republican primary votes came from the Tampa/Orlando DMAs. On the flip side, there is the poor old Gainesville DMA. (No wonder we are ignored and don’t get to see many cool TV commercials.)
Next on tap is to project the anticipated turnout for 2018 – that is a little more involved and not for publication.
Besides my cynical problems with authority, I get a little flabbergasted when people take flippantly very complicated concepts, especially things we do as political consultants.
In an attempt to be more patient, please allow me explain myself.
The Science of Going Viral
Besides Gladwell’s The Tipping Point, there are two main books to look at when attempting to understand why and how things “go viral”:
Principle 1 – Simplicity – an idea stripped to its core.
Principle 2 – Unexpectedness – we must generate interest and curiosity
Principle 3 – Concreteness – sticky ideas are full of concrete images
Principle 4 – Credibility –
Principle 5 – Emotions – we must make them feel something
Principle 6 – Stories – we tell stories
If we look at Jonah’s 6 principles:
Principle 1 – Social Currency – How does it make one look to talk or share?
Principle 2 – Triggers – what trigger are we going to use?
Principle 3 – Emotion – some emotions increase sharing, others actually decrease it.
Principle 4 – Public – can we see others engaging in our desired behavior?
Principle 5 – Practical Value – How can we craft content that seems useful?
Principle 6 – Stories – What broader narrative can we wrap our idea in?
“There are six principles of contagiousness: products or ideas that contain Social Currency and are Triggered, Emotional, Public, Practically Valuable, and wrapped into Stories.” (Contagious, Berger)
So as we can see, there is a bit of actual science and heavy lifting that goes into creating a viral video. It is no flippant matter.
I would highly recommend reading all three books, but Heath sums up the main issue we have with politicians & their desire to “go viral.”
As Heath writes, “The most basic way to get someone’s attention is this: Break a pattern.”
According to Alex Patton’s Grand Unified Theory of Political Communication, in order to get a voters attention in this fragmented, cluttered world – we must be novel or shocking (break a pattern).
Immediately, we run into issues with a stereotypical politician’s request to “go viral” !
The Risk Tolerance of Politicians
If you have done any work with politicians, you will find the most risk adverse set of clients you will ever come across.
Let’s think back to our stereotype.
Do you think that guy’s natural inclination is to take wild risks and break patterns?
Getting a politician or candidate to agree to even explore the fundamental requirement of going viral is extremely difficult, at best.
Political Positive Deviance – Going Viral
Let’s search out some positive deviance to learn from specifically from the political world:
A Google search of “Political Viral Videos” is illuminating:
Why is is illuminating? In the top 2012 videos – not a single one of them was made deliberately by a politician. Yes, several of them star politicians, but none of them were designed or created by a politician. NOT ONE.
There are two three examples that I can recall off the top of my head of politicians purposefully creating ads that went viral. They also happen to be some of my favorite ads:
We are Better that that! – Dale Peterson
Demon Sheep Ad
We may even include a third:
Pigs – Ted Yoho
What do all of these have in common?
The candidates were desperate enough to take risks.
I’ve spoken with the gentleman that created the Demon Sheep ad, and they were desperate to change the conversation at the time of the ad.
Dale Peterson had little money, little name ID and was most likely going to get creamed. What did he have to lose?
Ted Yoho was running against a 27 year incumbent in a Congressional primary and did not nearly have the resources available to him. At the time of the ad, according to what polls you believe, he was down 5-9 points.
Again, ALL DESPERATE enough to take risks and break patterns.
Interestingly, when you study risk & human behavior, humans become MUCH less risk adverse when they “have nothing to lose.”
Conclusion
There is a point to this post.
In every case in which our firm has won national recognition, it was because a client was willing or desperate enough to take risks.
There is something about having your back to the wall.
The problem with risk? We may fail. And as we all know, when one fails on the Internet, one fails for all of mankind to witness and share.
So, before you flippantly request your political consultant to make you a digital media campaign that will go viral, you need to assess your tolerance for risk.
Because, the only way to make a video of your talking head tax presentation ‘go viral’ may be to loosen the screws in your chair so that it collapses ending in an uninterrupted stream of your cussing while a cat slinks by to close the video.
PS Finally, IF we are lucky enough to strike gold and have something go viral, we may want to discuss the value to your campaign of getting 100,000 karma on reddit and 1,000,000 you tube views comprising of people outside your voting district. (but that is another post)
Ozean was surprised and honored to be mentioned in Campaigns & Elections Magazine as one of their “Consulting blogs to bookmark”
Ozean Media Political Consulting Blog
Ozean Media itself is not exclusively a political consulting firm, but part of its focus is on Republican political campaigns. The firm devotes a section of its blog to political consulting, and frequently posts updates on topics relevant to the consulting world. Be sure to check out the Friday posts where the blog goes in search of a “Eureka” moment.
We use cookies on our website to give you the most relevant experience by remembering your preferences and repeat visits. By clicking “Accept”, you consent to the use of ALL the cookies.
This website uses cookies to improve your experience while you navigate through the website. Out of these, the cookies that are categorized as necessary are stored on your browser as they are essential for the working of basic functionalities of the website. We also use third-party cookies that help us analyze and understand how you use this website. These cookies will be stored in your browser only with your consent. You also have the option to opt-out of these cookies. But opting out of some of these cookies may affect your browsing experience.
Necessary cookies are absolutely essential for the website to function properly. These cookies ensure basic functionalities and security features of the website, anonymously.
Cookie
Duration
Description
cookielawinfo-checkbox-analytics
11 months
This cookie is set by GDPR Cookie Consent plugin. The cookie is used to store the user consent for the cookies in the category "Analytics".
cookielawinfo-checkbox-functional
11 months
The cookie is set by GDPR cookie consent to record the user consent for the cookies in the category "Functional".
cookielawinfo-checkbox-necessary
11 months
This cookie is set by GDPR Cookie Consent plugin. The cookies is used to store the user consent for the cookies in the category "Necessary".
cookielawinfo-checkbox-others
11 months
This cookie is set by GDPR Cookie Consent plugin. The cookie is used to store the user consent for the cookies in the category "Other.
cookielawinfo-checkbox-performance
11 months
This cookie is set by GDPR Cookie Consent plugin. The cookie is used to store the user consent for the cookies in the category "Performance".
viewed_cookie_policy
11 months
The cookie is set by the GDPR Cookie Consent plugin and is used to store whether or not user has consented to the use of cookies. It does not store any personal data.
Functional cookies help to perform certain functionalities like sharing the content of the website on social media platforms, collect feedbacks, and other third-party features.
Performance cookies are used to understand and analyze the key performance indexes of the website which helps in delivering a better user experience for the visitors.
Analytical cookies are used to understand how visitors interact with the website. These cookies help provide information on metrics the number of visitors, bounce rate, traffic source, etc.
Advertisement cookies are used to provide visitors with relevant ads and marketing campaigns. These cookies track visitors across websites and collect information to provide customized ads.