
Ranked Choice Voting – an adventure
Ranked Choice Voting (RCV) and Ice Cream

With the pending Democrat primary race for Mayor in NYC using Ranked Choice Voting (RCV), we are thinking through the process of how to properly poll Rank Choice Voting and how to write the back-end code to do the analysis.
What I thought would be a weekend in project has turning into a completely different beast. If you ever want to move from theory to execution of something – write code for it. Writing code forces you to explore the details and try to attempt to anticipate errors etc.
In these blogs posts, I will not attempt to give a primer on Ranked Choice Voting. Others have done that well:
Bias Alert – you should know that I am not sold on RCV as a method of voting in the United States because it adds layers of complexity to a system – counting votes – that we are currently struggling with in the United States. As we will soon discover, each detail / decision is a thread for someone to pull on that could further cast doubt on our voting systems.
What I will attempt to do is walk through our fake data set and explain our logic on polling / coding and address various decision making. I will highlight issues that I see as potential problems in polling / casting votes.
In our exercise, we were going to ask people to “rank choice vote” flavors of ice cream. What could possibly go wrong???
ISSUE #1 – Presentation of Ballot
As a rule when polling, you want the poll to resemble the actual voting process as much as possible.
Even before collecting data, we were presented with a couple of issues / deicision points:
- Presentation of Ballot – method
- Allowing errors or not
As one of the people who took the poll pointed out, there are multiple ways of actually presenting the ballot – and it appears New York City is using two different methods.
There is an array and a multi-screen approach. NYC’s sample ballot shows an array and online NYC demonstrates RCV on something called an ‘AutoMark Ballot Marking Device’ uses the multi-screen approach (https://www.vote.nyc/page/ranked-choice-voting).
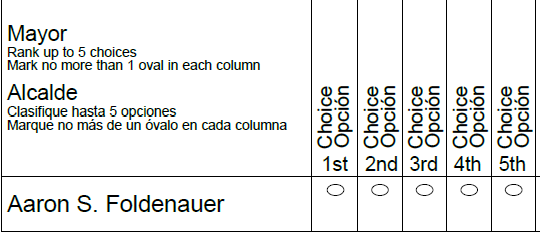
NYC Sample Ballot

MYC Automark Ballot
NYC isn’t clear on what method is used when, and finding out the details was outside the scope of my weekend project.
While our online software has the ability to do either type of question, I decided for this exercise to use the multi-screen approach. Why, to allow for error….
ISSUE #2 – Error Handling
As another reader pointed out, it would have been helpful, if we would have removed their previous choices from screens. Example, if they picked Vanilla, it should be removed from future choices. It would NOT have been difficult to do; however…..
It doesn’t appear that is what is being done in NYC on the printed ballot or the multi-screen approach. It appears that errors are allowed (butterfly ballot anyone). I would need to speak to an electronic voting machine expert to explore IF machines allow a voter to error or not, but with paper ballots we can’t code out human error.
Therefore, when programming the survey, we “errored” on allowing the voter to “error” – even though the “rules” clearly state if you vote twice for something your vote will be “spoiled” (We will have much more on that later).
ISSUE #3 – Instructions
As a “voter” / “survey respondent” pointed out – we had a problem with definitions / unclear instructions. The instructions were to “Rank Choice Vote” for ice cream flavors. We did this purposefully to mimic the ballot instructions.
Some people were confused asking should I vote for “my favorite” or “my least favorite”, requesting more descriptive instructions. I assume this confusion would exist on any ballot.
In addition, it appears many “voters” “survey respondents” didn’t realize there was a space on each choice for a “write in.”
Conclusion
Even before data collection or simulated voting – we made two decisions (ballot presentation and error handling) that could potentially have a material effect(s) on the results, and we haven’t even started coding results yet.
The challenge with this when you study system failures of any kind, it is not normally one huge error that causes failure, it is an accumulation and compounding of smaller errors.
But for now with those decisions made, we collect data….