by Alex Patton | Mar 6, 2018 | Political Consulting
Daily, we get a new approval rating on Donald Trump and NONE of them agree. It seems my Republican friends believe his approval is skyrocketing and my Democrat friends believe it is in the toilet. Both can’t be right….or can they?

The Battle of the Polling Methods
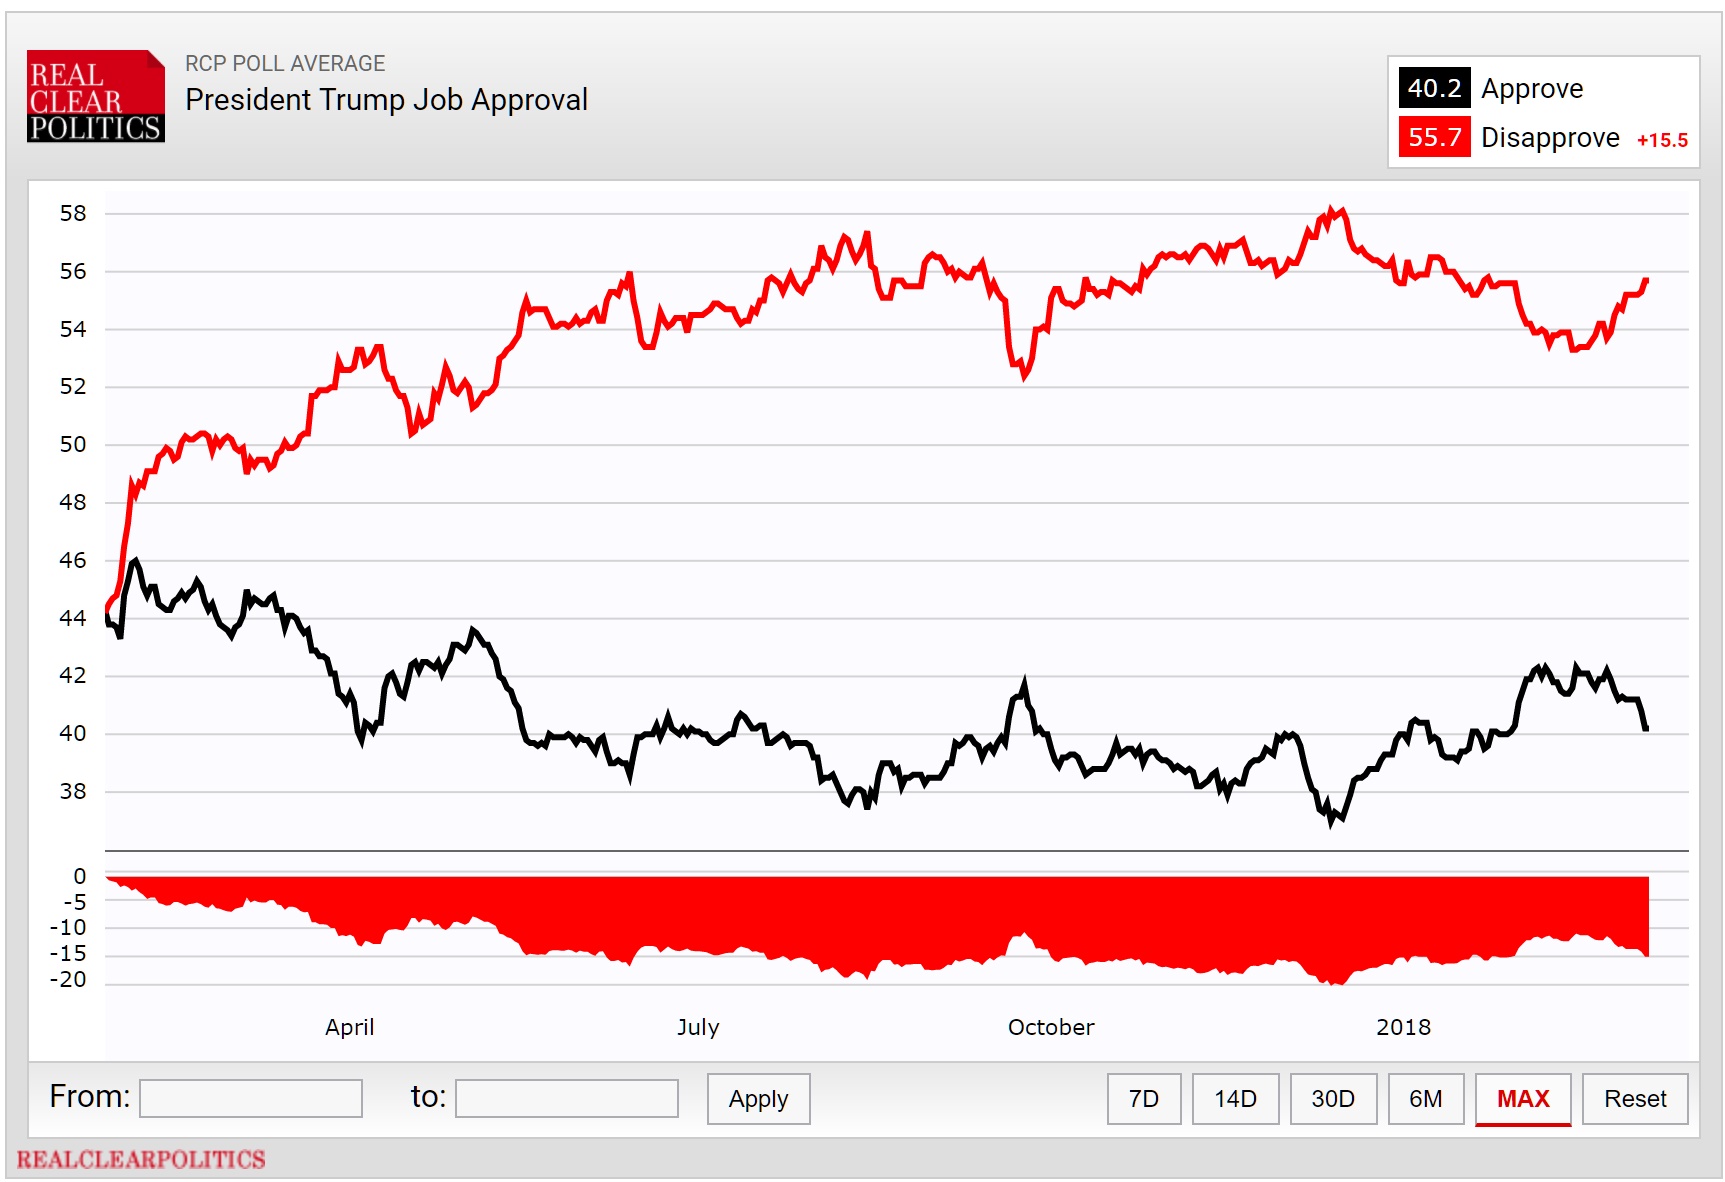
I did a quick review of the individual polls using data from Real Clear Politics.
The scuffle always seems to track back to Rasmussen Polling. When a new Rasmussen poll is released, it seems it is covered extensively by Fox News and Drudge. Why? Because the polling consistently rates POTUS higher than all the other polls.
Is Rasmussen dishonest? Or is Rasmussen nailing it and everyone else idiots?
The differences lie NOT with the intentions, but with the methodology.
Rasmussen polls likely voters. Rasmussen discloses this on their methodology page:
“For political surveys, census bureau data provides a starting point and a series of screening questions are used to determine likely voters. The questions involve voting history, interest in the current campaign, and likely voting intentions.
Rasmussen Reports determines its partisan weighting targets through a dynamic weighting system that takes into account the state’s voting history, national trends, and recent polling in a particular state or geographic area.”
Rassmussen takes into account prior voting history in their methodology – nothing shady and they disclose it.
All other pollsters are polling registered voters or adults. What is the difference?
Turns out, a lot.
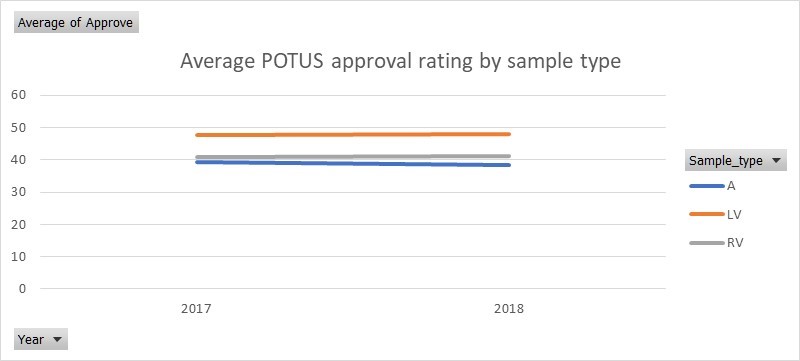
Using RealClear Politics data, I simply grouped the polls by sample type (A=adults, LV=Likely Voters, RV=Registered Voters). This graph is a simple average of the approval ratings. (yes, this is a very simplistic way of looking at this problem, but it is illustrative).
As you observe, there is a significant difference between likely voters and all other types. (You can also observe how flat it POTUS’s rating have been, but that is another post.)
As you can see, different methodologies are leading to consistently different results.
So, which method is correct? Normally, I would have no issue with Rasmussen’s methodology. In normal times, voter turnout is remarkably stable from election type to election type; however, these are not normal times.
In special elections leading into today, Democrat candidates are OUTPERFORMING their baseline partisan index by approximately 15%.
This simply means, NON-likely voters are showing up in these elections and are likely to show up for the upcoming midterms – young voters, minorities, and angry people. Rasmussen is missing these voters in their methods and thus painting a rosier picture than the likely, current reality.
The challenge is partisans on both sides are engaging in misusing polling data to push a narrative, and people are buying it. People only pay attention to the polls they like, disregard others as ‘bad polling.’ Most people are not informed consumers of polling data and this confusion leads to the further erosion of confidence in polling.
It is a toxic misuse of polling, and it needs to stop.
However, the cynic in me knows it isn’t likely to stop; therefore, we need to become better consumers of polling data.
The next time someone says, “The President is on his way to 50% approval!” you must reply “Among who?” Because the answer matters….a lot.
PS For a much deeper dive, Survey Monkey did an excellent write-up/experiment using the Roy Moore Senate race in Alabama and illustrating how different methodologies lead to huge variances in polling results. Past vote vs. intention: an Alabama Senate race
by Alex Patton | Feb 9, 2018 | Political Consulting
Ever have that book that stays with you and gnaws at you well after you finish reading it? One of my recent reads has been How Not to Be Wrong: The Power of Mathematical Thinking by Jordan Ellenberg. It is a highly recommended read, but Chapter 17 is causing me heartburn. It is entitled “There is No Such Thing as Public Opinion.”
Why heartburn? I wrote a paper in graduate school taking issue with that old adage that “Americans are ideologically conservative but operationally liberal.” I did a poor job expressing and supporting my view and my paper’s grade reflected it. However, Ellenberg says what I was attempting to say, just much more eloquently.
“Each voter has a perfect rational coherent political stance, but in the aggregate, their position is nonsensical” (p 367).
For example, we did some polling on the medical marijuana issue. I will simplify, but the results were as such:
- 1/3 of respondents opposed any legalization of marijuana.
- 1/3 of respondents supported legalization of marijuana for only medical use.
- 1/3 of respondents supported full legalization of marijuana.
After the completion of the polling, the following statements were made about the polling:
- MAJORITY OF PEOPLE POLLED OPPOSE LEGALIZATION OF MARIJUANA.
- MAJORITY OF PEOPLE POLLED SUPPORT SOME FORM OF LEGALIZED MARIJUANA.
Both statements tell different stories about public opinion, and both statements are true. When you aggregate the three choices, they no longer make sense.
When Americans and democracy are offered more than one choice, it gets messy because “majority rules” systems work best with two choices, not three. (which returns to a theory of why political parties exist – to offer clear choices.)
Returning to the inconsistency of aggregate judgments. “The majority isn’t a unified entity that follows logic” (p 374). This is why public opinion tells us repeatedly that Americans want a smaller government with less spending. However, when offered choices of 13 categories of government spending, more people want to increase rather than cut in 11 of the categories.
Ellenberg makes the following conclusion – and this is what gives me heartburn:
“I think the right answer is that there are no answers. Public opinion doesn’t exist. If there is no such thing as public opinion, what’s an elected official to do? The simplest answer: when there’s no coherent message from the people, do whatever you want” (p 369).
Frankly, I am still noodling this through, but my heartburn continues but now for different reasons. Enjoy your weekend.
Photo by Rob Schreckhise on Unsplash
by Alex Patton | Jul 16, 2015 | Political Consulting, Political Research
This week Politico featured an article The End of the 2016 Election Is Closer Than You Think The Politico article is a fantastic read, but doesn’t go into the particulars that I would like to explore.
Yes, the Politico article in someways scooped a theme I have been working on for sometime on this blog. In the past I have been exploring the formation of political environments and asking “Do Campaigns Really Matter?”
Time for Change Model – Predicting POTUS elections
There are many reasons for developing and using models. Often models are used to present a hypothesis in a clear manner. We argue about models, back test them, refine them, and then use them to predict outcomes.
One of the most interesting models in Presidential elections is Alan Abramowitz’s Time for Change Model based on what is now referred to as the campaign fundamentals. Abramowitz has since revised his model, and we will look at both versions of the models.
The first Abramowitz model was:
PV=47.3+(.107*NETAPP)+(.541*Q2GDP)+(4.4*TERM1INC)
- PV stands for the predictive share of the majority party vote of the incumbent president
- NETAPP stands for the incumbent president’s net approval rating (approval-disapproval) in final Gallup poll in June
- Q2GDP stands for the annualized growth rate of real GDP in the second quarter of the election year, and
- TERM1INC stands for the presence or absence of an first term incumbent in the race
“This basic model has correctly predicted the winner of the popular vote in the last 5 presidential elections with an average error of 2 percentage points.” -Abramowitz
So, why change the model?
Because in the last 4 Presidential elections, the basic model overestimated the winning candidate’s share of the votes. “This suggests that the growing partisan polarization is resulting in a decreased advantage for candidates favored by election fundamentals including first term incumbents.: – Abramowitz
The revised Abramowitz model is:
PV=46.9+(.105*NETAPP)+(.635*Q2GDP)+(5.22*TERM1INC)-(2.76*POLARIZATION)
- POLARIZATION – takes on the value of 1 when there is a first term incumbent running or in open-seat elections when the incumbent president has a net approval rating > 0; it takes on a value of -1 when there is not a first-term incumbent and the incumbent president has a net approval rating <0.
“Adding the Polarization correction to the model substantially improves its overall accuracy and explanatory power” – Abramowitz
FRIENDLY REMINDER: The outcome is determined by the electoral college, not the popular vote predicted by this model.
Where does the model stand now?
NETAPP – the net approval of President Obama
If we look at Gallup’s polling results for President Obama’s Approval Rating – we can see currently it is +3%.
(What is surprising for most in Conservative circles is just how much the President’s net approval rating has been positive for his two terms. His average approval from the beginning of his first term to the writing of this post is 47%.)
Q2GDP (annualized growth rate of real GDP in the second quarter of the election year). The number obviously has not been released yet, but we can look at trends.
| GDP (% change from Preceding Period in Real Gross Domestic Product) |
|
|
|
|
|
2013 |
|
|
|
2014 |
|
|
|
2015 |
|
| Quarter |
I |
II |
III |
IV |
I |
II |
III |
IV |
I |
II |
| GDP |
2.7 |
1.8 |
4.5 |
3.5 |
-2.1 |
4.6 |
5 |
2.2 |
-0.2 |
TBD |
TERM1INC – We know there is no incumbent in this election, so we KNOW this variable is 0.
POLARIZATION – We assume President Obama has a net + approval rating, so the variable will be set to 1.
Thought Exercise
While the model specifically states the GDP needs to be from Q2 of the election year (2016), as nerds we can have some fun.
If we were to perform the calculation now simulating an election this year with the following variables:
- using the current net approval rating of +3,
- the Average of the GDP Change over Obama’s term of +2.175%, (using the -.2 would be cruel)
- TERM1INC =0, and
- POLARIZATION = 1,
we calculate the incumbent party (Democrat) predicted vote % to be 45.8%.
| Variables |
|
|
|
|
|
|
| NETAPP |
3.00 |
|
|
|
|
|
| Q2GDP |
2.18 |
|
|
|
|
|
| Q2GDP Increment |
0.50 |
ignore |
|
|
|
|
| TERM1INC |
0 |
Presence or Absense of Incumbent (1 Incumbent, 0 no incumbent) |
|
| POLARIZATION |
1 |
1 – first time incumbent or in open seat incumbent appr >0, = -1 no first time incumbent and incumbent approval <0 |
|
|
|
|
|
|
|
| PV=46.9+(.105*NETAPP)+(.635*Q2GDP)+(5.22*TERMINC)-(2.76*POLARIZATION) |
| PV=party of incumbent % |
46.9 |
(.105*NETAPP) |
(.635*Q2GDP) |
(5.22*TERM1INC) |
(2.76*POLARIZATION) |
Estimate Q2GDP |
| 45.8 |
46.9 |
0.3150 |
1.3811 |
0 |
2.76 |
2.18 |
Abramowitz Model
Below is an interactive model that we can explore, plugging in your own variables.
Type in the yellow boxes and the sheet will give you the results – (incrementally increasing the GDP by the variable you provide)
The Abramowitz Time for Change Model is also inserted on a clean page all to reduce clutter for your enjoyment.
Ramifications
PV=46.9+(.105*NETAPP)+(.635*Q2GDP)+(5.22*TERM1INC)-(2.76*POLARIZATION)
As you can see, the model weights the GDP much higher than the net approval rating (by a factor of 6x), but the power of incumbency is considerable.
The model provides the incumbent party with a base of 46.9%, then adjusts for Net Approval, then adjusts for GDP, then adjusts for incumbency advantage/incumbency fatigue.
For example, if President Obama is +8 on Net Approval, the GDP change would need to be +8% change in Q2 2016 for the incumbent, Democrat party to break 50% with no incumbent running. (Note don’t forget to change TERM1INC variable to 0)
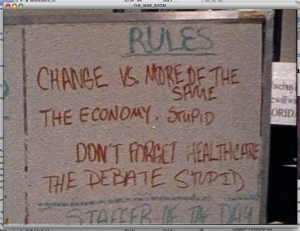
Admittedly, it is too early to use a model that explicitly states it is Q2 of the election year, but we can clearly remember Carville’s “It’s the economy stupid!”
If you believe the model, the next 12 month’s events are critical in determining the 2016 outcome and there is little the 40 people running for President can do about it – except drive down the net approval rating of the President. Get ready!
Ramifications for Local Elections
As we observe with my prior posts, Politico’s article, and the exploration of Alan Abramowitz forecasting model, the central thesis is this: the political environment is formed for success or failure well before any candidate announces a run for office. Campaigns do not change political environments but rather are a product of them.
These macro fundamentals are largely out of the control of Presidential candidates and even more so out of the control of state and local candidates.
However, local political environments can be shaped with local issues with a dedicated and consistent effort. Therefore, I’ll say it again: Attention all interest groups and political actors interested in the upcoming local elections: To be strategic in local elections, the time to form the political environment is a year before the elections, not the 6 weeks of a campaign before the election date.
by Alex Patton | Jun 12, 2015 | Political Consulting
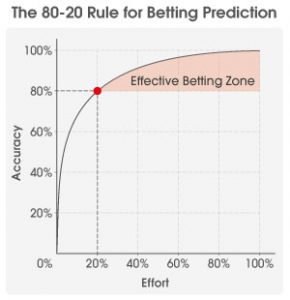
I’ve been thinking about the amount of effort required to have an opinion.
What drove this strain of thought: I was having a conversation with a subject matter expert and I voiced my opinion.
He replied, “That is certainly an opinion, but to have an accurate opinion, you need to do a lot more work.”
How true.
The amount of effort to have an opinion is zero. My 11 year old son will have an opinion about anything you ask him. Trust me, A.N.Y.T.H.I.N.G.
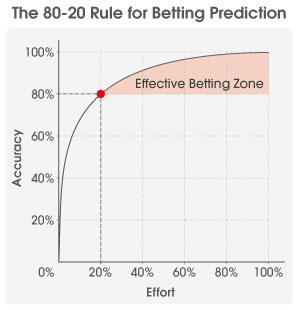
The amount of effort to have an accurate opinion is a lot more than you may realize.
Sometimes it is the cursedly clear and unwelcomed set of answers provided by straight thinking that makes us mental slackers.” -Robert Cialdini
To be a successful analytical thinker, you must be willing to consider competing ideas. Sometimes you may not welcome those competing ideas. What if they are valid?
Analytical thinking is difficult and requires effort, but attempting to identify and mitigate biases may be more difficult.
Anyone can have an opinion, but to have an informed opinion, the effort is considerable.
Biggest Change
One of the biggest changes in how I approach a problem or analysis has been the effort to move from a binary, black and white thinking to a probability thinking.
An example, I try and no longer say silly things such as “Candidate A will not win that campaign.” That is simply not a true, logical statement. Candidate A by being on the ballot has some probability of winning that race. The probability may be extremely low, but there is some probability.
“Candidate A chances of winning that race are below 10%” is a much better way of expressing my thinking.
When one starts thinking in probability terms, one’s entire perspective changes. Things not possible, become remotely possible. Things that are 51% certain are no longer “certain.”
Conclusion
One becomes a clearer thinker when one becomes aware of the probability of being wrong; thus forcing one to put in the required effort to arrive at a better analysis/opinion.
Bottom line, I think the political scene needs more humility in our thinking.
by Alex Patton | May 7, 2015 | Political Consulting, Political Research
I anticipate some blow-back on this blog post, but “since my intent is to write something useful to whoever understands it, it has appeared to me more fitting to go directly to the effectual truth of the thing than to the imagination of it” (Machiavelli 61).
In a previous post, we dared to ponder the question, “Do political campaigns really matter?” We looked at the curious case in Alachua County where two Republican campaigns were run in the same election cycle – one campaign was essentially a name placed on the ballot; the other campaign was a robust campaign. We observed a mere 2.2% difference in the results. We also took note of the complete dominance of the Democratic Party in Alachua County elections.
Hegemony: leadership or dominance, especially by one country or social group over others.
But we also noted the recent success of more conservative members of the Gainesville City Commission – arguably the most conservative commission in 15 years.
How do we reconcile these two things and what can we gleam from the situation in regards to campaigns and politics?
The Search for Positive Deviance
The Search for Positive Deviance
Anytime we start a new analysis, we look to see if anyone has already done the work and we look for positive deviance.
Positive deviance (PD) is an approach to behavioral and social change based on the observation that in any community, there are people whose uncommon but successful behaviors or strategies enable them to find better solutions to a problem than their peers, despite facing similar challenges and having no extra resources or knowledge than their peers. These individuals are referred to as positive deviants Wikipedia – positive deviance
We had mentioned before, that since 2002, 4 Republicans have won Alachua County in county-wide, partisan races.
Let’s examine these campaigns:
| year |
race |
winner |
winner% |
| 2010 |
USSEN |
Rep |
40.01% |
| 2010 |
CC4 |
Rep |
54.03% |
| 2006 |
AGR |
Rep |
51.46% |
| 2004 |
Sheriff |
Rep |
51.84% |
In the 2010 USSEN race, Senator Marco Rubio was the top voter in a three way race. So, our first strategy would be to split the hegemony’s power with a two way split. For now, we table that suggestion.
In the 2010 County Commission race, Republican Susan Baird defeated long time incumbent and current Democrat county chair, Cynthia Chestnut.
In 2006, long time incumbent Republican Agriculture Commissioner Charles H. Bronson beat unknown Eric Copeland after Copeland switched from a CFO campaign after fellow Democrat Alex Sink got into the CFO campaign. (You knew Copeland was in trouble when he launched his Agriculture Commissioner campaign with “The incumbent has done an adequate job representing the interests of Agriculture in Florida.”)
In 2004, long time incumbent Republican Steve Oelrich beat neophyte challenger Bill Davis for Alachua Sheriff.
If we look for positive deviance in all three of these victories, we see the Democrats fielding poor candidates, neophyte candidates or in the case of Cynthia Chestnut – fielding a candidate that did not campaign at all.
However, the one thing the above three positive deviances share : the Democrats screwed up. (It is not my intention to take away from the Republican campaigns because they had to be in a legitimate position to take advantage of the Democrats’ mess up.)
If we also consider the Mayor’s race of 2013, when Republican Ed Braddy beat Democrat, incumbent Craig Lowe, we see a similar event – the Democrats screwed up.
So, we have identified a second strategy : field good, legitimate Republican candidates and hope and pray the Democrats screw up.
But there is another item the winning campaigns share which brings us to the third and I believe the most important strategy: the political environment was formed before the campaigns ever took place.
If we reconsider the case of Craig Lowe, we can observe a series of events that happened well before his re-election campaign ever started.
Criag Lowe’s first term was highlighted by:
Another local example is the biomass issue. Nathan Skop based his campaign on the disaster that is the GREC biomass contract. He is a subject matter expert and foretold all the calamity barreling towards Gainesville. Skop was right on the issue, but lost the campaign. Why? The political environment had not been formed successfully – yet. As the issue matured and macerated, the City of Gainesville has witnessed significant political change on the City Commission.
Yet another local example is from 10 plus years ago with the fight against Alachua’s comprehensive plan – Lee Pinkoson and Cynthia Chestnut were successful in ousting two incumbents because the political environment had been formed before they entered the campaign.
This is the recipe for success! I can tell you from experience; a lot of people aren’t going to like the taste.
The Recipe for Success
The time voters are most open to persuasion is during non-campaign contexts.
These elected officials must never have a week off. These elected officials must have every move examined with a ruthless intensity and an inexorable contrasting of values. The critique must be unrelenting, and the criticism must garner press coverage. The effort required is a long, uncivil, and confrontational process; it requires resources.
The goal is to drive the negatives of those in power to as close to 50% or higher or strategically place them on the wrong side of public opinion on issues – before any Republican campaign comes into a nascent state.
Here is the catch: There are virtually no organizations or groups willing to pay the price to do what must be done for the length of time it must be done. Not many people or organizations will risk the press labeling them malcontents or gadflies or uncivil.
Not many people are willing to be the “bad guy” for anything other than a single issue and a short period of time.
The political party can not take the lead role, because they minute they take the lead, the issue becomes partisan and it forces voters put on their partisan, team jerseys. The critique must be received before voters put on their partisan jersey because once the critique is perceived as purely partisan, the critique will not be considered. The party and politically partisan groups can play a supporting role.
The local ‘advocacy’ business groups will not play this natural role because they fear retribution and risking their prestigious goodwill. These groups continue to attempt to play an apolitical role in a political system and continue to believe politics is a genteel exercise in rationality that can be massaged and performed outside the public arena. These advocacy groups must understand the role of Solomon can be effectively played only when there are two competing sides presenting.
Political change is not rational, genteel, private nor delicate; it is the opposite.
Conclusion
To review the possible strategies:
- Do nothing and accept the status quo.
- Field good Republican candidates and force three way contests with liberals being 2/3 of the candidates.
- Field good Republican candidates and wait for the Democrats to screw up.
- Put in the long, controversial work needed in the form of a permanent campaign in order to form the political environment well before candidate campaigns start.
I have been espousing this recipe for several years because I believe in seizing one’s own fate. I have discussed these ideas with other political experts in depth and they agree with the recipe. So far the idea has been considered offensive and met with scorn.
I realize this recipe is controversial, but again my goal is to write something useful, not imaginary. To change the hegemony, a “political bad guy” must operate 365 days a year.
Said nicely: To make change permanent, there must be a competing viewpoint offered on a permanent, consistent and unrelenting basis. In order to do it correctly, there must be a institutionalized effort comprised of people that do not fear retribution.
Any community that desires change in a hegemony does a tremendous disservice to any candidate when they complain behind closed doors only or speak up 6 weeks before election day.
The heavy lifting and dirty work must be done before and outside candidate campaigns – after all, even Jesus needed John the Baptist to lay the groundwork for his work to be successful.
by Alex Patton | May 1, 2015 | Political Consulting
Why in the world would a campaign consultant ask the seemingly heretical question, “Do political campaigns really matter?”
The answer: partially purposefully provocative combined with another part intellectual curiosity, but as we prepare to spend billions of dollars to elect our next President, we should explore the question.
The Interesting & Peculiar Case of Alachua County
As a political operative in a Democratic dominated area, I’ve run multiple campaigns in this Democratic stronghold of a county. I have the scar tissue to prove it.
Active Registered Voters as of:05/01/15
- Democrats:74,076
- Republicans:45,165
- Others:39,406
- Total:158,647
Knowing the odds, I’ve often wondered what would happen if one Republican candidate ran a campaign and one Republican didn’t. Would it matter? Interestingly, Alachua County was presented with that scenario in 2014.
Peculiar Case of the Alachua 2014 Tax Collector Campaign
In 2014, Alachua County experienced the most gentle and amiable campaign maybe ever witnessed by mankind.
In this year, Alachua County held a partisan, open election for Tax Collector. Both candidates seemingly made a gentleman’s agreement not to say anything other than complimentary things about one another. For campaign operatives used to mixing it up, this campaign was an anathema.
Jon C. Costabile’s, the Rep, total expenditure was $11,770.00.
Summary of campaign : He qualified by petition. He put up some signs, printed small runs of campaign literature, and repaid close to $6,500 in candidate loans.
John Power’s, the Dem, total expenditure was $32,466.00.
Summary of campaign: He printed some palm cards, put out some signs, sent 2 mail pieces, paid qualifying fee and repaid $6,000 in candidate loans.
Tax Collector Campaign Summary
| Name |
Party |
Tot. Exp |
Total Vote |
% Vote |
| Jon Costabile |
REP |
$11,770.00 |
30,864 |
41.15% |
| John Power |
DEM |
$32,466.00 |
44,145 |
58.85% |
It is truly difficult to describe just how much of a non-event, non-campaign this was. Both candidates were genuine friends, and the entire campaign consisted of “I would like the job, but if my opponent is elected, it’s cool.” The campaign had little to no media coverage, little to no actual campaigning.
In summary, the Republican spent a little over $5,000 in a county-wide, partisan race.
While boring and bewildering, this campaign provides a unique case study getting to the question of “In Alachua County, if a Republican candidate does little more than put their name on the ballot, what % of the vote would they obtain?”
In a sense, this 2014 tax collector campaign provides the baseline for Republican candidates in Alachua County.
Campaign Comparison
At the exact same time in 2014, Alachua County had a hotly contested County Commission race between Republican John Martin and Democrat Ken Cornell. These two guys were the antithesis of the tax collector race. They did comparing and contrasting media and for all intents and purposes both candidates ran robust campaigns.
John Martin’s, the Republican, total expenditure was $65,945.00
Summary of campaign: No primary, signs, mailers, tv, phone calls, newspaper.
Ken Cornell’s, the Democrat, total expenditure was $101,535.11
Summary of campaign: Contested primary campaign, mail, television, polling, campaign staff, radio
Because of the primary, we break out contributions and expenditures using the primary date as the demarcation line:
| Cornell $ |
Contributions |
Expenditures |
| Primary |
$56,605.81 |
$44,856.08 |
| General |
$55,332.50 |
$56,782.23 |
County Commission Campaign Summary
| Name |
Party |
Tot. Exp |
Total Vote |
% Vote |
| Jon Martin |
REP |
$65,945.00 |
32,769 |
43.35% |
| Ken Cornell |
DEM |
$101.535.11 |
42,816 |
56.65% |
So we are now able to compare and contrast the two types of campaigns during the same election cycle: no campaign versus a more robust campaign.
In a macro view and with a 6x difference in expenditure amount between the Republican candidates, what change in results do we observe between the non-campaign and the robust campaign? +2.2%.
Historical Comparison
Just to remove the doubt that there was something specific about these two campaigns, I also looked at ALL partisan, county wide races in Alachua County since 2002.
| Total Races |
46 |
| Rep Wins |
4 |
| Dem Wins |
42 |
Noting the differences between Presidential and Gubernatorial election years, we find:
|
Average Win % |
| Average Dem Pres Yr |
63.34% |
| Average Dem Non-Pres Year |
58.76% |
So we can observe these two campaigns are at the averages of all campaigns since 2002.
Conclusions / Questions
So have we definitively proved that campaigns don’t matter? No, I don’t think so. We can conclude that running Republican candidates county wide in Alachua County is extremely difficult regardless of the campaign.
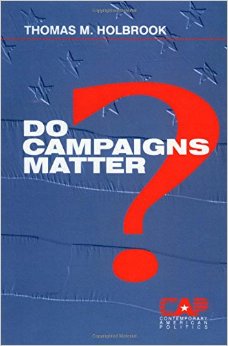
But we aren’t the only ones asking the question. With the renewed focus on modeling and fundamentals, we see it all around us. Thomas Holbrook dared to ask the same question in his 1996 book “Do Campaigns Matter?” and David Farrell and Rudiger Schmitt-Beck dared to ask the same in 2002 with “Do Political Campaigns Matter? Campaign Effects in Elections and Referendum”
The debate rages on.
The political nerd term is “campaign effects”.
To unpack the effects of campaigns, it is helpful to think about when exactly campaigns matter. Two factors are paramount: the number of undecided voters and the balance of resources among the competing candidates.” – John Sides and Jake Haselswerdt, George Washington University
A summary of the findings? Campaigns do matter, when all things are equal, and campaigns matter at the margins.
Most importantly, we can take this knowledge and ask some additional questions:
Noting the recent success of Republicans / Conservatives in the City of Gainesville elections, how can we reconcile that success with elections in Alachua County?
If we can explore that question, then we will have the recipe to break inertia in Alachua County? (and I have my next blog post)
Next week : The Recipe for Success to Break Inertia in Alachua County for Republicans