Introduction to Florida Solar: The Map We Could Not Make
We set out to answer a simple question. “In the US, where is the gap between solar potential and reality?”
We were initially ambitious and set out to make a national map, but we quickly ran into a computing capacity problem. So, we pivoted to limiting our research to my home state, Florida: “The Sunshine State.”
We could not do that.
As soon as we attempted to access reliable datasets, we hit a wall. We discovered that we could not reliably map the “installed” capacity because the federal data is fundamentally broken. It effectively shows zero solar activity in Florida’s regions that we know are growing.
Consequently, we had to abandon the idea of a gap analysis. Instead, we pivoted to a pure potential analysis. We decided to ignore the broken federal records and focus entirely on the physical reality of the infrastructure in Florida.
Here is what we found when we stopped looking at the paperwork and started looking at the roofs.
The Solar Gap: By the Numbers
- Total “Revenue at Risk”: ~$105 Billion Annually
- Total Energy Potential: ~702,000 GWh/year
- Roofs Identified: >8.1 Million
- The Data Gap: Federal databases are missing 92% of Florida’s actual solar activity.
Florida: The Sunshine State’s “Ghost” Market
If you explore federal energy data, Florida’s residential solar market appears dormant. According to the Lawrence Berkeley National Laboratory (LBNL), which is the gold standard for U.S. solar tracking, Florida has installed only about 0.18 GW of residential solar capacity.
This number is wrong. In fact, it is wrong by a factor of 13.
Our analysis of the Florida Public Service Commission’s (PSC) own filings reveals that as of late 2023, the actual installed capacity was over 2.35 GW. Somewhere between the monopoly utilities and the federal databases, the data is disappearing.
Why does this matter? Because you cannot fix what you cannot measure. While top-level state and federal reports might acknowledge the total, the Feds nor cannot tell you where the solar is. Nor what mix of utility scale or rooftop exists. By relying on this broken data, policymakers are blinded to the true velocity of Florida’s energy transition. To see the real picture, we had to build a new map from the ground up.
Methodology: Counting the “Size of the Prize”
We didn’t want to know what is installed. We wanted to know what could be.
Using a “Layer Cake” methodology, we modeled the Gross Theoretical Potential of every building in Florida. This wasn’t a sampling exercise; we ran the entire state.
- Inventory the Roofs: Using Overture Maps (based on open map data), we extracted footprints for over 8.1 million buildings in Florida. We calculated the areas for all rooftops.
- Apply the Sun: We mapped NREL’s solar irradiance data (PVWatts V8) to every single roof to account for local weather patterns (Sun Scores).
- Calculate the Value: We assumed a standard panel efficiency (17%) and a conservative retail rate ($0.15/kWh).
- Overlaid Political Boundaries: We stratified this data across Congressional, State Senate, State House, and County boundaries.
This calculation gives us the Gross Addressable Market and localized economic model for every political jurisdiction in the state.
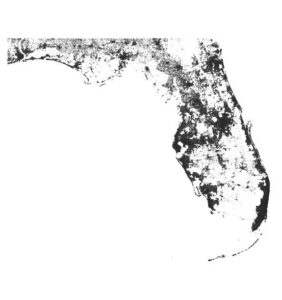
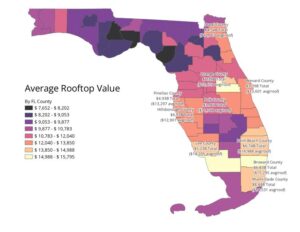
Every Rooftop in Florida Mapped
The Findings: Florida, A Potential $105 Billion Annual Solar Economy
The results are staggering. If fully utilized, Florida’s residential rooftops could generate over $105 Billion in energy value every single year.
This is capital that currently leaves the local economy to utility monopolies. It could instead stay in the pockets of homeowners and local businesses.
The Findings: A Multi-Level Analysis of Value
When we aggregated this data by political boundaries, an interesting pattern emerged. It isn’t just that Florida has a lot of sun; it’s that the value of that sun is unequally distributed based on the architecture of the housing stock.
We normalized the data to look at “Average Annual Potential Value Per Roof.” This strips away population density and highlights the efficiency of the infrastructure.
The Congressional Divide
The data reveals a massive value gap between the Panhandle and Southwest Florida.
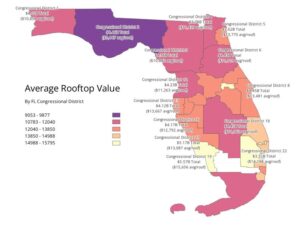
Top 3 Congressional Districts by Average Roof Value:
Southwest Florida dominates due to high irradiance and large, single-story home footprints.
| District | Representative | Annual Value Per Roof | Total District Potential |
|---|---|---|---|
| CD-19 | Byron Donalds | $15,656 | $5.57 Billion |
| CD-22 | Lois Frankel | $14,198 | $3.32 Billion |
| CD-21 | Brian Mast | $13,981 | $4.37 Billion |
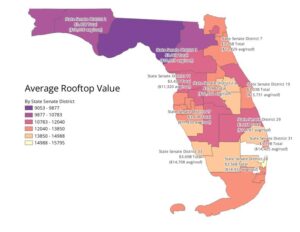
The State Senate Analysis
The Senate map reveals a distinct “U” shape of high value, wrapping around the coast from Tampa to Naples, across the Everglades, and up the Gold Coast (Miami/Ft. Lauderdale).
Interestingly, urban density in Miami does not dilute the per-roof value as much as expected. Large multi-family footprints and flat commercial-style roofs keep the averages high in District 33.
| District | Region/Location | Annual Value Per Roof | Total District Potential |
|---|---|---|---|
| District 28 | Collier/Hendry/Lee | $14,932 | $3.56 Billion |
| District 33 | Miami-Dade | $14,708 | $3.69 Billion |
| District 31 | Martin/Palm Beach | $14,425 | $3.19 Billion |
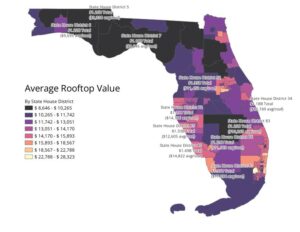
The State House Outliers
When we zoomed in to the State House level, we found specific pockets of extreme economic density.
State House District 81 (Collier County) is the single most valuable solar real estate in Florida. The average roof there has a gross potential of $17,284 per year.
| District | Region/Location | Annual Value Per Roof | Total District Potential |
|---|---|---|---|
| HD-81 | Collier | $17,284 | $1.37 Billion |
| HD-80 | Collier/Hendry | $14,822 | $1.49 Billion |
| HD-72 | Sarasota | $14,716 | $1.29 Billion |
The County Commission View
For County Commissioners, the data represents local economic retention. Every dollar spent on grid power is a dollar leaving the county to a monopoly utility (or in the case of muni-owned staying with the monopoly utility and not voters).
While Miami-Dade is the volume leader with $8.44 Billion in total potential, Collier County is the efficiency leader.
| County | Total Potential Value | Avg Value Per Roof |
|---|---|---|
| Miami-Dade | $8.44 Billion | $14,531 |
| Palm Beach | $6.74 Billion | $14,988 |
| Collier | $2.47 Billion | $15,808 |
| Orange | $6.39 Billion | $15,659 |
The Problem: IOU Greed and The Rate Base
So, if the economic incentives are clearly present, why isn’t this transition happening faster in the Sunshine State?
Investor-Owned Utilities (IOUs) make money on capital expenditures or building big things and charging ratepayers a guaranteed return on equity. They are interested in solar only when they can put it in their “rate base.” They are NOT interested in decentralized rooftop solar because it looks like revenue erosion to them. In fact they have for years been openly hostile towards rooftop solar in Florida.
Meanwhile, these same utilities continue to secure massive rate increases. As reported recently by Jason Garcia, Florida just approved the largest electric rate increase in history. The gap between what we pay for power and the value we could generate ourselves has never been wider.
Florida’s “Sun Tax”
The data suggests that residents in these high-value districts (CD-19, HD-81, Collier County) are paying a steep “opportunity cost.”
By remaining solely reliant on the centralized grid, they are importing power at retail rates while sitting on the state’s most valuable generation assets.
This value, $105 Billion annually statewide, is currently being captured by monopoly utilities who view rooftop solar as a threat to their rate base. As noted by Jason Garcia, these same utilities recently secured the largest rate hike in Florida history.
Caveats: Understanding the Model’s Limits
It is vital to be transparent about what this model is and what it is not. This is a Gross Potential Model, designed to identify the total size of the market opportunity. It is not an engineering plan.
- We did not model shading: We did not use LiDAR to subtract for tree cover or neighboring building shadows.
- We did not model azimuth: We assumed total roof area availability, not just South-facing portions. In reality, HVAC units, vents, and complex roof lines reduce usable space.
- We did not model structural integrity: Not every roof can support the weight of a system.
- We assumed 100% adoption: Obviously, not every homeowner wants or can afford solar.
Because of these factors, our numbers represent the ceiling of what is possible, not the floor of what is probable. However, even if you apply a conservative 25% “Technical Reduction Factor” to our numbers, you are still looking at a $26 Billion annual market that is being ignored by federal data and stifled by utility policy.
Conclusion
Florida’s solar market is being hampered by a lack of good data and an abundance of monopoly political power. We cannot rely on federal databases to tell us the truth about what is happening on the ground. We have to look at the infrastructure itself.
The sun shines on everyone in Florida (except the FSU Seminoles), but right now, the profits are only shining on a few. It’s time to unlock the sun and the data.