Oh Miami! The city of my favorite show as a kid (Miami Vice), white sand beaches, Cuban food, and a kaleidoscope of culture. This Florida boy loves him some Miami.
Miami-Dade is the county that includes the Miami we all know and love.
Miami (Dade County) is also a Democrat stronghold in Florida, with Democrat Presidential candidates averaging over 60% – until 2020.
Miami-Dade is arguably at the epicenter of President Trump’s 2020 victory in Florida.
Something interesting happened in Miami, and we are trying to answer, “How did DJT increase his vote margin in Miami-Dade in 2020?”
2016 versus 2020
Donald Trump won Florida in 2016 and 2020. In 2016 he won with 49%, and in 2020 with the absence of a strong third-party candidate increased his vote to 51.2%, a 2.2% increase.
Miami-Dade was approximately 10.5% of Florida’s total vote in 2016 and 2020. It is Florida’s largest block of voters on a county basis.
In reviewing the data, Miami-Dade explodes off the page because DJT increased his vote share there by 7.2% – or nearly triple his statewide gains.
In today’s hyper-partisan world, we often see changes on the margins – not in this case.
A 7% move in a Democratic stronghold deserves a much more detailed examination.
| MD – DJT % | Dem % | DJT MD % Statewide | MD % Statewide | DJT FL Vote | Dem FL Vote | |
| 2016 | 33.8% | 63.2% | 7.2% | 10.4% | 49% | 47.8% |
| 2020 | 46.0% | 53.3% | 9.4% | 10.5% | 51.2% | 47.9% |
| delta | +7.2% | -9.9% | +2.2% | +.1 | +2.2% | +.1% |
For this analysis, I am going to exclude any precincts with less than 100 total votes.
Republican Voters
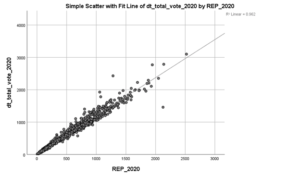
Of course, we expect the vote totals for President Trump to be highly correlated with the Republican vote.
In this graph, we explore precinct results with the Y axis is the vote total for President Trump, and the X axis is the number of Republicans voting. We observe a R2 of .962.
This graph is displayed so that when review the Hispanic Vote, we have a comparison point.
Hispanic Voters
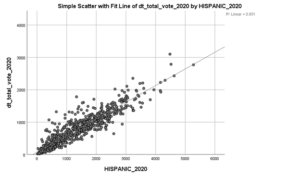
In this graph, we look at precinct results with the Y axis is the vote total for President Trump, and the X axis is the number of Hispanics voting.
We observe a R2 of .851!!
Trump and Hispanic Vote in Miami Dade
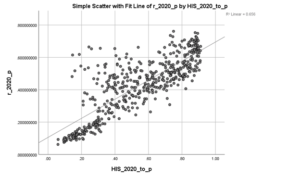
Next we explore the marginals –
This displays by precinct, the Republican vote share (%) by the Hispanic voter turnout (Hispanic voters / total voters %) in 2020.
In addition, we observe when the data deviates from the fit line, it is tending to deviate much more on the high side of the line.
Performing a simple linear regression of the two variables:
| Coefficientsa | ||||||
| Model | Unstandardized Coefficients | Standardized Coefficients | t | Sig. | ||
| B | Std. Error | Beta | ||||
| 1 | (Constant) | .06 | .011 | 9.365 | .000 | |
| HIS_2020_to_p | .589 | .019 | .810 | 30.953 | .000 | |
| a. Dependent Variable: r_2020_p | ||||||
For every 1% increase in vote total for Donald Trump, we see an increase of over a half of percent in Hispanic turnout.
Simply put the more Hispanic a precinct became, the more votes DJT received.
We can visualize this a different way:
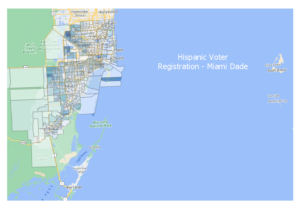
Here is a map of the hispanic voters in Miami-Dade County by Precinct.
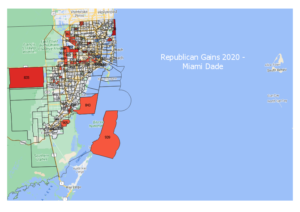
Next, we explore the greatest gains by precinct for DJT from 2016 to 2020.
That cluster of votes split by Okeechobee Blvd is heavily Hispanic and some of Trump’s largest gains.
Conclusions
The GOP has long had a strategy of attacking an opponents strength. And Miami-Dade can long be thought of as a Democrat stronghold.
It appears the gains in Hispanic voters for Donald Trump were significant in Miami-Dade and while they do not explain all of his gains they do explain a significant part of his gains.
GOP staffers earned some stripes on this one. From a blocking and tackling perspective – well done!

