Overview
For the most part, voters in Alachua County performed about as one would expect.
Of all campaigns that were partisan and county wide, Democrats averaged 58% and Republicans averaged 42% of the vote. This is in-line with historic returns going back to 1996.
There were no major deviations, except for two things:
- Republican Kay Abbitt won a school board race (in a primary, and that is a different post)
- Single Member Districts (SMD), even with the controversial campaign, (also, also, also) passed.
It is SMD that I am interested in exploring.
Results
SMD passed with 51% of the vote.
It passed with a slim margin of 2,567 votes or 51%, but SMD did +9% points ‘worse’ than the baseline Democrat partisan result in the county races (average of 42%).
This is interesting.


Dem Performance and SMD No Votes Are Highly Correlated
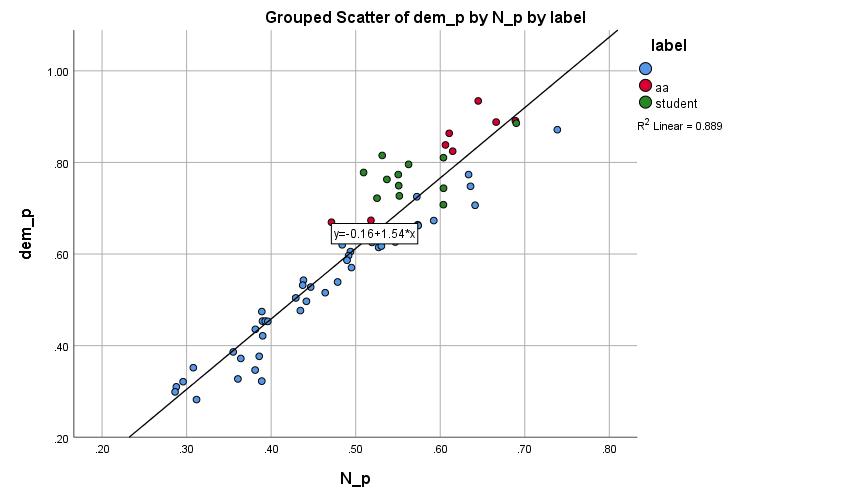
If we plot precinct’s percentage returns of Democrat performance (I used Alford vs Eagle County Commission race as a baseline) on the x axis, the SMD NO vote on the Y axis, we observe the two votes are highly correlated (.943 Pearsons) with an R² of .889. (A perfect correlation is 1.0).

If you voted Dem (on a county commission race), you likely voted ‘no’ on SMD. Partisanship was a main driver.
So, what happened?
There are two main clusters of deviation from the fit line:
- Precincts with high percentage of registered voters, A18-34. (Defined as >=50%)
- Precincts with high percentage of African American voters. (Defined as >=30%)
Under-Performance
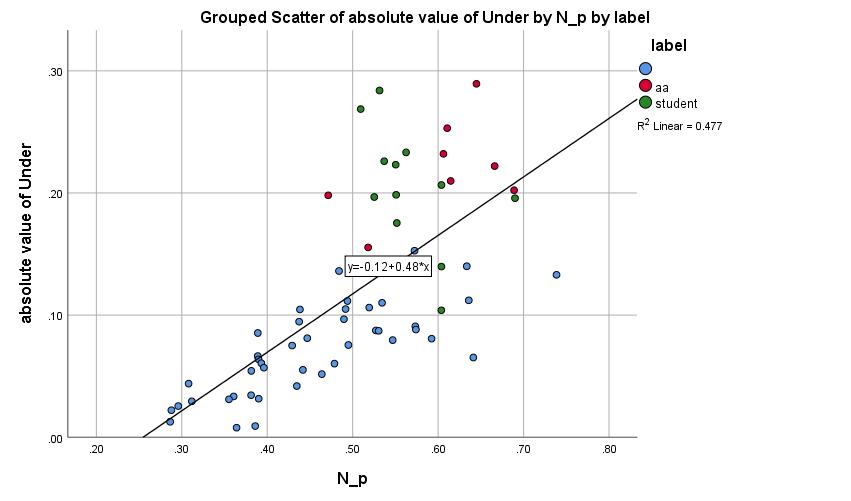
First we will explore under-performance, Democratic performance – No Vote on SMD.
On average, under-performance voting was 12%. However, there are a two clusters of outliers with the highest being 29%.
Exploring the precincts that are ~2x the average:
| Precinct | Under-performance |
| 13.0-Mt. Carmel Baptist Church* | 0.29 |
| 31-J. Wayne Reitz Union^ | 0.28 |
| 39.0-Doyle Conner Building^ | 0.27 |
| 55.0-Gateway Christian Center* | 0.25 |
| 40.0-Comfort Suites^ | 0.23 |
| 33-Ironwood Golf Course* | 0.23 |
| 59.0-Days Inn Hotel^ | 0.23 |
| 44.0-Phillips Center for the Performing Arts^ | 0.22 |
| 28-McPherson Recreation Center* | 0.22 |
| 30-Greater Bethel A.M.E. Church* | 0.21 |
| 7.0-Ignite Life Center^ | 0.21 |
| 19.0-Springhill Baptist Church* | 0.2 |
| 23.0-Florida Museum of Natural History* | 0.2 |
| 43-Grace United Methodist Church* | 0.2 |
| 36.0-Hilton UF Conference Center^ | 0.2 |
| 25.0-SFC Blount Center^ | 0.2 |
*Bold indicates AA precinct
^indicates student precinct

Voter Fatigue
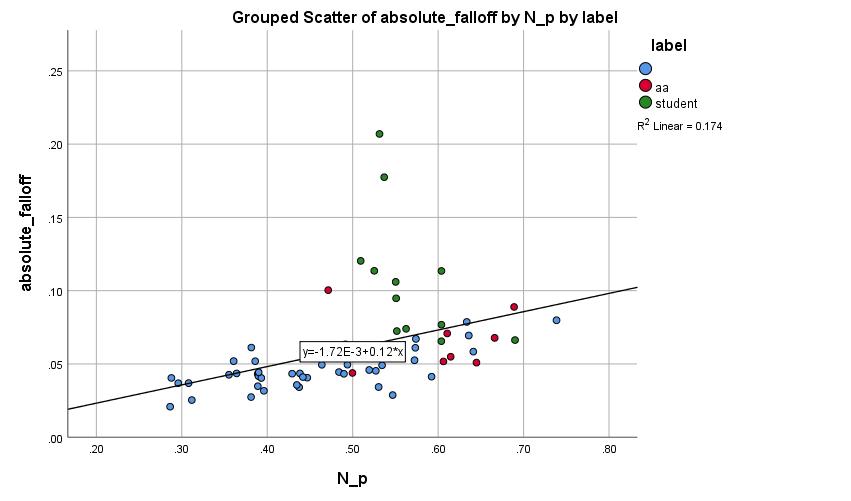
As with most down ballot issues, we also look at fall-off or voter fatigue. These are precincts that had voters that cast a vote in the County Commission campaign and for whatever reason didn’t cast a vote in SMD question.
On average, fall off / fatigue was 6%. However, there are a couple of outliers with the highest being 21%.
So who didn’t make it down the ballot? For the most part, they are precincts where younger voters comprise at least 50% of the registered voters.
As you can see 7 of the top 10 precincts that fell off are ‘student’ precincts (as defined by me as registration A18-34 >=50% of total registration).
| Precinct | Fatigue |
| 31-J. Wayne Reitz Union^ | 0.21 |
| 59.0-Days Inn Hotel^ | 0.18 |
| 39.0-Doyle Conner Building^ | 0.12 |
| 36.0-Hilton UF Conference Center^ | 0.11 |
| 5.0-First Lutheran Church^ | 0.11 |
| 44.0-Phillips Center for the Performing Arts^ | 0.11 |
| 43-Grace United Methodist Church* | 0.1 |
| 23.0-Florida Museum of Natural History^ | 0.09 |
| 19.0-Springhill Baptist Church* | 0.09 |
| 27-The Thomas Center* | 0.08 |
| 12.0-Parkview Baptist Church* | 0.08 |
*Bold indicates AA precinct
^indicates student precinct
Precincts comprised of younger voters experienced higher rates of voter fatigue for SMD.

Conclusions
So, what is the bigger “sin”?
| Precinct | under performance | fall off |
| Average | Average | |
| other | 7% | 5% |
| aa | 21% | 7% |
| student | 20% | 11% |
| TOTAL | 12% | 6% |
Voting and not making it all the way through the ballot? (students)
OR
Voting and breaking with your party? (African Americans)
Regardless, two ‘bases’ of the national Democrat party coalition under-performed at this local issue :young voters and African American voters.
If you are looking for 1,300 votes to change an outcome, either one is a good option. (Average size of AA precincts is~1000 votes cast, student precincts ~1100 votes cast)
However, which is a bigger ‘surprise’? Students not casting a vote for a local issue that doesn’t affect them much – OR – African Americans breaking from their local party’s position?
Finally, what is the better campaign strategy?
Asymmetric warfare using a ‘trusted’ messenger of the NAACP?
OR
Attempting nothing but to ride a partisan advantage and trusting a newspaper with declining readership to carry the message?
