I hope you had a great 4th of July. As a true nerd, I spent some time looking at American National Election Studies (ANES) data. For those unfamiliar with the data, it began at the University of Michigan and now is a jointly done with Stanford. The survey research is conducted prior and after Presidential elections – often asking the same questions over multiple series.
It is a treasure trove of data, open to the public, and if you are unfamiliar with the data set, check it out.
Because, if you find yourself with a free weekend and a curiosity, you may be able to tease out some interesting finds.
This is where I found myself. I was thinking again about the hyper-partisan political times we find ourselves in and playing around with ANES data.
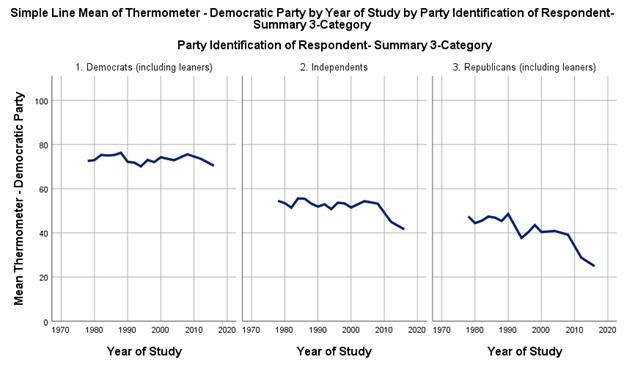
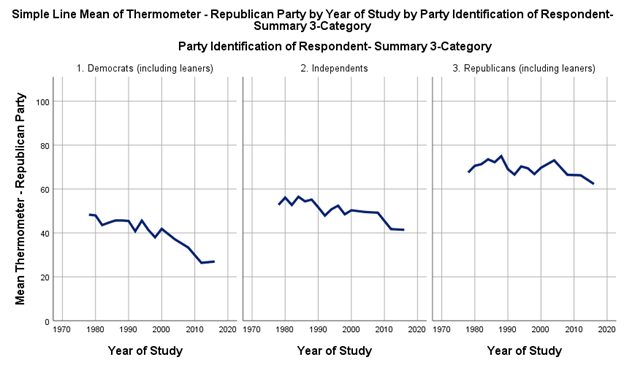
ANES has used a feeling thermometer to measure how people feel about the political parties. On a scale of 0 – 100, how do you feel about the _____ party?
I looked at a panel that collapsed party identification to inlclude those that leaned towards one party or the other.


Observations
Just a couple of quick observations:
- On average, Republicans like their own party slightly less than Democrats like theirs.
- Independents are really just going to independent – they don’t really like either party. (makes sense, if they did like one, they’d likely join one…)
- After 2000, that seems to be the date things really changed.
- The hyper-partisanship appears mostly driven by negative partisanship.
Big picture, on average – how we feel about our own party hasn’t changed THAT much. It wouldn’t explain what we see in today’s politics.
However, how we feel about the OTHER party has nose-dived after 2000. And it is / has happened on both sides of the aisle.
It appears the parties have sorted, closed ranks, and now the change in our politics is defined by what we don’t like.
