All the BEST Polls Agree With Me

In today’s Science Friday, we explore biases in polling – BUT we explore it from the angle of the interpretation of polls. 

In a paper from Madison & Hillygus (both from Duke), they conclude that while most political nerds will evaluate a poll by reviewing the methodology, sample size, and question wording, “we find a significant factor in respondent assessments of polling credibility to be the poll results themselves.”  Said a different way they “found that polls were perceived as more credible when they matched a respondent’s prior opinions and less credible when they did not.”

Experiments

The researchers conducted two experiments – one with polling a candidate and one with polling a policy issue.   It was a relatively simple experiment design – measure your priors, introduce polling, measure the change in your perceptions. 

In both instances, the researchers find motivate reasoning.  

“Overall, these results of attitude polarization, together with the findings above showing a poll’s perceived credibility being conditional on congruence with prior beliefs, indicates that evaluations of polling information are biased by motivated reasoning.

Conclusions

This finding is concerning.  We often use polls to pop “bubbles” that politicians and consultants find themselves to be in. 

We position survey research and polling as “objective” research and a way to check critical assumptions.  This study illustrates that polling results are not being absorbed objectively. 

However, if the hyper-partisan political atmosphere is allowing political actors to disregard any research finding, we are in dangerous territory.  

citation:  Madson, G.J., Hillygus, D.S. All the Best Polls Agree with Me: Bias in Evaluations of Political Polling. Polit Behav 42, 1055–1072 (2020). https://doi.org/10.1007/s11109-019-09532-1


download the paper

Trumps Victory in Miami-Dade Florida in 2020

Trumps Victory in Miami-Dade Florida in 2020

Oh Miami! The city of my favorite show as a kid (Miami Vice), white sand beaches, Cuban food, and a kaleidoscope of culture. This Florida boy loves him some Miami.

Miami-Dade is the county that includes the Miami we all know and love.

Miami (Dade County) is also a Democrat stronghold in Florida, with Democrat Presidential candidates averaging over 60% – until 2020.

Miami-Dade is arguably at the epicenter of President Trump’s 2020 victory in Florida.

Something interesting happened in Miami, and we are trying to answer, “How did DJT increase his vote margin in Miami-Dade in 2020?”

2016 versus 2020

Donald Trump won Florida in 2016 and 2020. In 2016 he won with 49%, and in 2020 with the absence of a strong third-party candidate increased his vote to 51.2%, a 2.2% increase.

Miami-Dade was approximately 10.5% of Florida’s total vote in 2016 and 2020. It is Florida’s largest block of voters on a county basis.

In reviewing the data, Miami-Dade explodes off the page because DJT increased his vote share there by 7.2% – or nearly triple his statewide gains.

In today’s hyper-partisan world, we often see changes on the margins – not in this case.

A 7% move in a Democratic stronghold deserves a much more detailed examination.


MD – DJT % Dem % DJT MD % Statewide MD % Statewide DJT FL Vote Dem FL Vote
2016 33.8% 63.2% 7.2% 10.4% 49% 47.8%
2020 46.0% 53.3% 9.4% 10.5% 51.2% 47.9%
 delta +7.2% -9.9% +2.2% +.1 +2.2% +.1%


For this analysis, I am going to exclude any precincts with less than 100 total votes.

Republican Voters

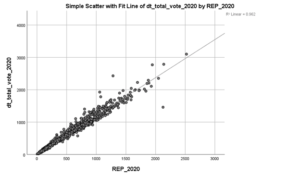
Of course, we expect the vote totals for President Trump to be highly correlated with the Republican vote.

plot of Trump by Rep voters Miami Dade

In this graph, we explore precinct results with the Y axis is the vote total for President Trump, and the X axis is the number of Republicans voting.   We observe a R2 of .962.

This graph is displayed so that when review the Hispanic Vote, we have a comparison point.

Hispanic Voters

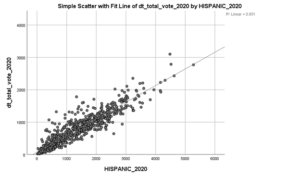
plot of Trump v Hispanic Voters Miami Dade

In this graph, we look at precinct results with the Y axis is the vote total for President Trump, and the X axis is the number of Hispanics voting.

We observe a R2 of .851!!

 Trump and Hispanic Vote in Miami Dade

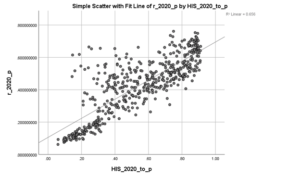
Next we explore the marginals –

Plot - DJT x Hispanic Voter - Percent

This displays by precinct, the Republican vote share (%)  by the Hispanic voter turnout (Hispanic voters / total voters %) in 2020.

In addition, we observe when the data deviates from the fit line, it is tending to deviate much more on the high side of the line.

Performing a simple linear regression of the two variables:

Coefficientsa
Model Unstandardized Coefficients Standardized Coefficients t Sig.
B Std. Error Beta
1 (Constant) .06 .011 9.365 .000
HIS_2020_to_p .589 .019 .810 30.953 .000
a. Dependent Variable: r_2020_p


For every 1% increase in vote total for Donald Trump, we see an increase of over a half of percent in Hispanic turnout.

Simply put the more Hispanic a precinct became, the more votes DJT received.

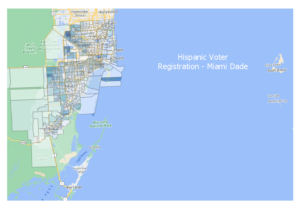
We can visualize this a different way:

Here is a map of the hispanic voters in Miami-Dade County by Precinct.

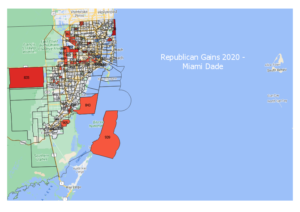
Next, we explore the greatest gains by precinct for DJT from 2016 to 2020.

Trump - precinct gains 2016 to 2020

That cluster of votes split by Okeechobee Blvd is heavily Hispanic and some of Trump’s largest gains.

Conclusions

The GOP has long had a strategy of attacking an opponents strength.  And Miami-Dade can long be thought of as a Democrat stronghold.

It appears the gains in Hispanic voters for Donald Trump were significant in Miami-Dade and while they do not explain all of his gains they do  explain a significant part of his gains.

GOP staffers earned some stripes on this one.  From a blocking and tackling perspective – well done!

Amelia’s 2021 TRENDS IN DIGITAL MEDIA, POLITICAL RESEARCH, AND DATA

Digital Media

Censorship has been an issue in the past as we know and it isn’t going anywhere in 2021. The problem will only increase as tech companies continue to gain power and influence. People on the right side of the aisle feel this issue far more than the left. It is no secret that these large tech companies lean far left. 90% of Republicans say it is likely that social media sites censor certain political viewpoints and there are so many different instances that have led a large majority of Republicans to feel this way. Twitter alone has locked President Trump out of his account dozens of times for extended periods of time during his presidency. Twitter and Facebook also worked together prior to the 2020 Presidential election to silence a New York Post article regarding the investigation of Hunter Biden to prevent harm to Joe Biden so soon to election day. These tech companies constantly play favorites and I predict the silencing of conservative voices will only get worse under the Biden administration over the next 4 years.

Political Research

Still following the topic of social media, there are hot-button words used online that trigger conservatives and liberals differently. A study was done at multiple universities such as Berkeley and John Hopkins where they scanned the brains of three dozen politically left and right leaning individuals as they watched videos on hop topics such as immigration. What they found was that liberals and conservatives responded differently when the content contained vocabulary that frequently pops up in political campaign messaging. This research showed a glimpse into the partisan brain and proved the power language can have in driving polarization or persuasion.

 Source for reference: 

https://www.sciencedaily.com/releases/2020/10/201020150509.htm

Political Data

After the 2020 presidential election, the majority of the youth turnout was for Biden over trump. The youth turnout is estimated to be between 52%-55% between the ages of 18-29 and has increased by 10% since 2016. Joe Biden was able to secure the youth vote over Trump by a 25-point margin but still more than a third of the youth vote (36%) supported Trump. It isn’t terribly surprising that the left has been able to sway the youth vote more in their favor. They are more savvy on social media with their campaigns and have a modern appeal that can easily sway new voters. The Republican party could use a digital facelift in order to win more of the youth vote in the next election cycle.

 Source for reference: 

 https://circle.tufts.edu/latest-research/election-week-2020#the-views-of-young-trump-voters


Ben’s 2021 Trends in Digital Media, Political Research, and Data

Digital Media

Peer-to-peer (P2P) Texting 

With an estimated 3 billion political texts sent during the 2020 election – texting has become an effective weapon for political campaigns. This number is expected to grow as more campaigns include texting in their political digital media portfolio. Prepare to have a full inbox every other November.

What do us political digital nerds like about texting? Open rates and speed. 

The average open rate for political texts sits around 70%-98%, which is much higher than the 15%-25% open rate for political email campaigns. In addition, campaigns are fast-paced and when opportunities arise, you have to act immediately. Unlike other forms of media, texting allows campaigns to send direct, personalized messages to targeted audiences within hours. In 2022, expect texting to be a staple of political campaigns.

Source for reference:

https://www.technologyreview.com/2020/10/28/1011301/why-political-campaigns-are-sending-3-billion-texts-in-this-election/


Political Research

While political texting is personal, direct, and effective – like all things – it isn’t immune to misuse and political shenanigans. Researchers at the University of Texas Center for Media Engagement studied texting shenanigans during the 2020 election. Although I do not endorse the conclusions of the authors, they do a great job providing examples of how political organizations and operatives are using political texting to communicate controversial – and sometimes unethical – messages with voters.  

Negative Campaign Message Attacking Joe Biden:

“Joe Biden endorsed giving 8 and 10 year olds sex change treatments. This is way too extreme for me. I can’t support him.” 

The study states, “this message, claiming to come from an unnamed ‘Democratic volunteer’, began lighting up on people’s phones in swing states like Michigan, Wisconsin, and Pennsylvania the week before the 2020 election.”

The Beto O’Rourke Campaign “Imposter”:

“Hi, it’s Patsy here with w/ Beto for Texas. We are conducting an internal poll and would like to know your thoughts on the dangers of socialism.”

In this example, an individual volunteered for the Beto campaign with the intention of turning voters away from the Democratic candidate. Volunteer “spies” have always existed – be careful who sends texts for your campaign!

Byron Donalds Fake Dropout Text:

On election day, candidate and now Congressman-elect for Florida’s 19th District, Byron Donalds, was the victim of a black-hat, dark money texting campaign. The text told voters that Donalds dropped out of the race – which was not true. 

There are plenty of other examples within the report. Whether ethical, unethical, controversial, or just good, solid messaging – political texting is a powerful tool for campaigns. We will see more of it in the coming years. 

Glover, K., Gursky, J., Joseff, K., & Woolley, S. C. (2020, October 28). Peer-to-Peer texting and the 2020 U.S. election: Hidden messages and intimate politics. Center for Media Engagement. 

Download the Report:

https://mediaengagement.org/wp-content/uploads/2020/10/Peer-to-Peer-Texting-and-the-2020-U.S.-Election.pdf

Political Data

How will the RNC use the “Trump-only” voter data? 

Over the past 4 years, the RNC and Trump campaign have collected an insane amount of voter data. Particularly, I am interested in the data collected on individuals who have never voted in their lifetime until casting a vote for Donald Trump in 2016 or 2020. As 2020 showed us, Republicans cannot afford to lose voters in key states and districts. The RNC knows who these people are. It will be interesting to see how the RNC plans to keep these “Trump-only” voters engaged during the post-Trump era as we gear up for the 2022 midterms.


What causes bumps in polls and polling?

What causes bumps in polls and polling?

An astute listener to the radio show, the Ward Scott Files, that deals with political strategy and polling asks, “What causes bumps in polling?”
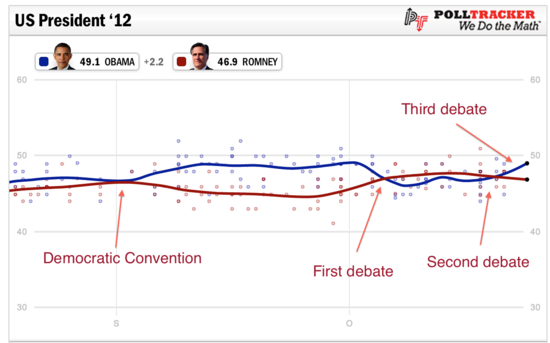
debate_chart_national

Bumps in Polling

Often after a candidate announces they are running for President, or after a major party’s political convention or some other major event, we will observe a bump in polling numbers.  In most cases, if we wait several weeks, the bump will disappear.

What are we actually observing with these “bumps” in polling numbers?

In an attempt to further answer the question, I came across a paper, “The Mythical Swing Voter” by Andrew Gelman, Sharad Goel, Douglas Rivers, and David Rothschild of Columbia University, Stanford University and Microsoft Research.

Political scientists have debated whether swings in the polls are a response to campaign events or are merely reversions to predictable positions as voters become more informed about the candidates (page 2)

The paper follows an interesting methodology in that it conducted 750,148 interviews with 345,858 unique respondents on the X-box gaming platform during the 45 days preceding the 2012 Presidential election – creating a large on-line panel for studying shifts.

What is interesting is that the data showed with demographic adjustments, the data reproduced swings found in media polls during the 2012 campaign.  HOWEVER, if we don’t use demographics, but instead use partisanship and ideology “most of the apparent swing in voter intention disappear.”

What the authors found was selection bias playing a role in the “bumps” candidates receive after a large announcement, meaning certain groups of people were much less/more likely to participate in a survey, and if we correctly estimate voters using items other than demographics, most of the apparent swings were sample artifacts, not actual change.

Only a small sample of individuals (3%) switched their support from one candidate to another.

We estimate that in fact only 0.5% of individuals switched from Obama of Romney in the weeks around the first debate, with 0.2% switching from Romney to Obama.

Conclusion(s)

The paper’s authors conclude “that vote swings in 2012 were mostly sample artifacts and that real swings were quite small.”

In today’s highly polarized partisan politics, the percentages of the Mythical Swing Voter is much smaller than polling would indicate.

Meaning, there is little to no actual bump or people switching sides – there is more of a selection bias in the polls.  “The polls do indeed swing—but it is hard to find people who have actually switched sides.” (page 2)

The temptation to over-interpret bumps in election polls can be difficult to resist, so our findings provide a cautionary tale. The existence of a pivotal set of voters, attentively listening to the presidential debates and switching sides is a much more satisfying narrative, both to pollsters and survey researchers, than a small, but persistent, set of sample selection biases.